Multiplicity dependence of \pT-differential \kaon/\pion (upper panels) and \pr/\pion (lower panels) ratios measured in pp collisions at $\sqrt{s}$ = 7 TeV and 13 TeV (blue and red, respectively) Lines represent different MC generator predictions for pp collisions at \cme{13}. Left to right: low-, intermediate-, and high-transverse momenta. Vertical bars, open, and shaded bands represent statistical, total systematic, and multiplicity uncorrelated systematic uncertainties, respectively. Numbers in the parenthesis in different panels represent different scale factors for data and MC predictions for better readability. | 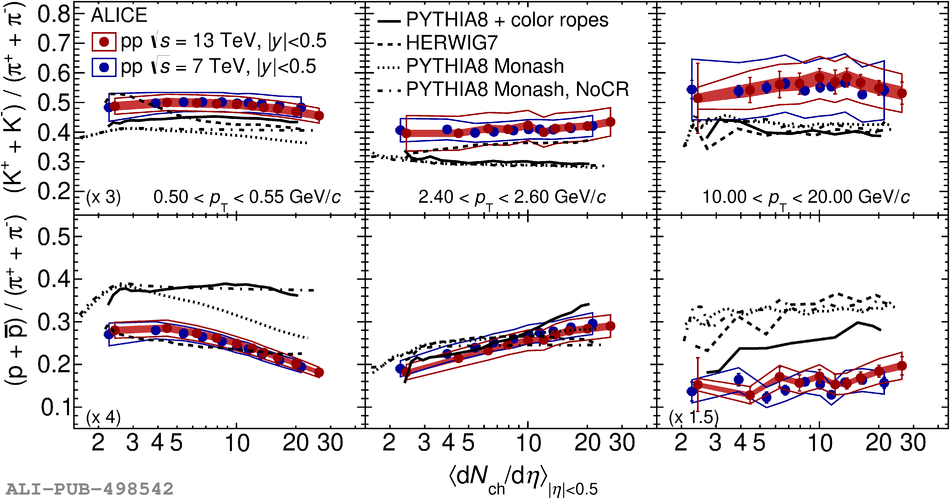 |