$A$ dependence of the $\gamma A$ cross section for the coherent production of a $\Rz$ meson and the corresponding power-law fit shown as a band. The data are from this analysis and from . The general expectations for three extreme cases are represented by the dashed, dotted-dashed, and dotted lines, respectively. The red band corresponds to the GKZ predictions when varying the parameters of the model. A power-law fit to the CCKT model is shown by the blue band. See text for details. | 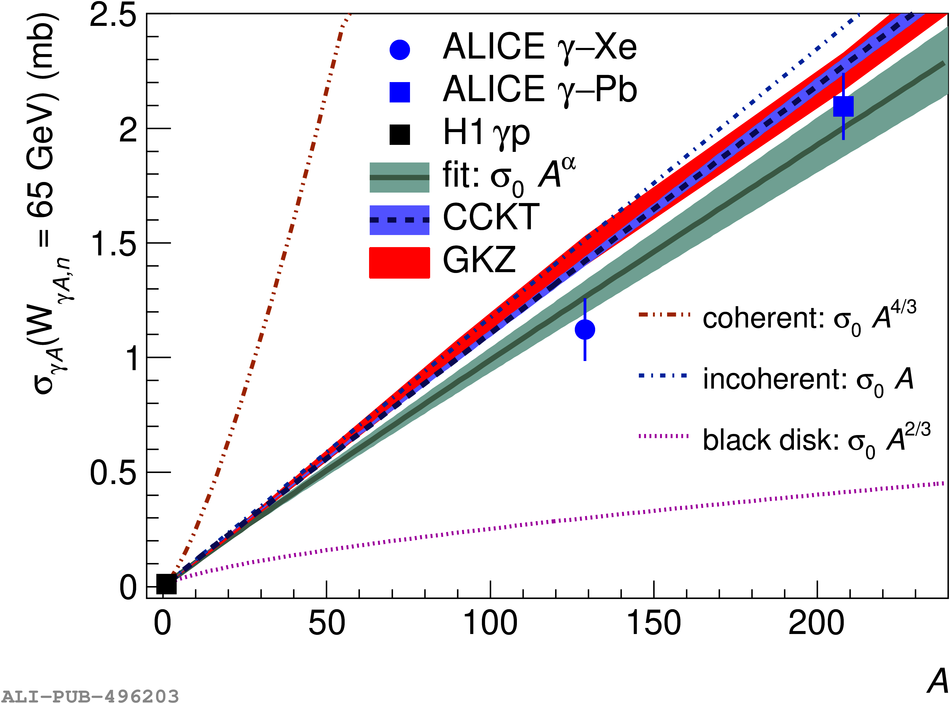 |