Dielectron excess spectra as a function of \mee (left) and \pTee(right) after subtraction of the hadronic decay cocktail. The error bars and boxes represent statistical and combined systematic uncertainties from data and cocktail. Arrows indicate upper limits at 90\% confidence level. Also shown as lines are calculations of bremsstrahlung from initial- and final-state hadrons , and thermal dielectron production . | 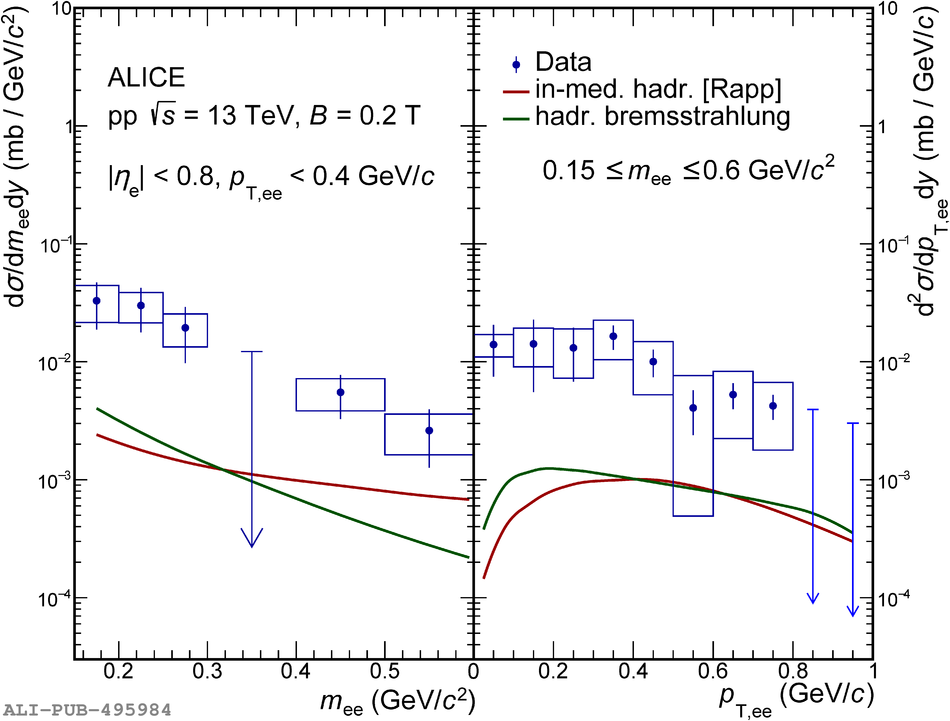 |