Results from the THERMINATOR 2 simulation implemented with an impact parameter $b = 2$ fm for the \LamKchP pair system Where experimental data are shown, lines represent statistical uncertainties, while boxes represent systematic uncertainties (a) the one-dimensional correlation function from THERMINATOR 2 together with the experimental data (b) the $\Re C_{11}$ component of a spherical harmonic decomposition of the THERMINATOR 2 simulation together with the experimental data The other four panels show the source distribution from the simulation in the (c) out, (d) side, and (e) long directions, as well as (f) the temporal characteristics, all in the PRF The source distributions have all been fitted with a Gaussian form over the regions contained within the dashed lines, the results of which are printed within the respective plots | 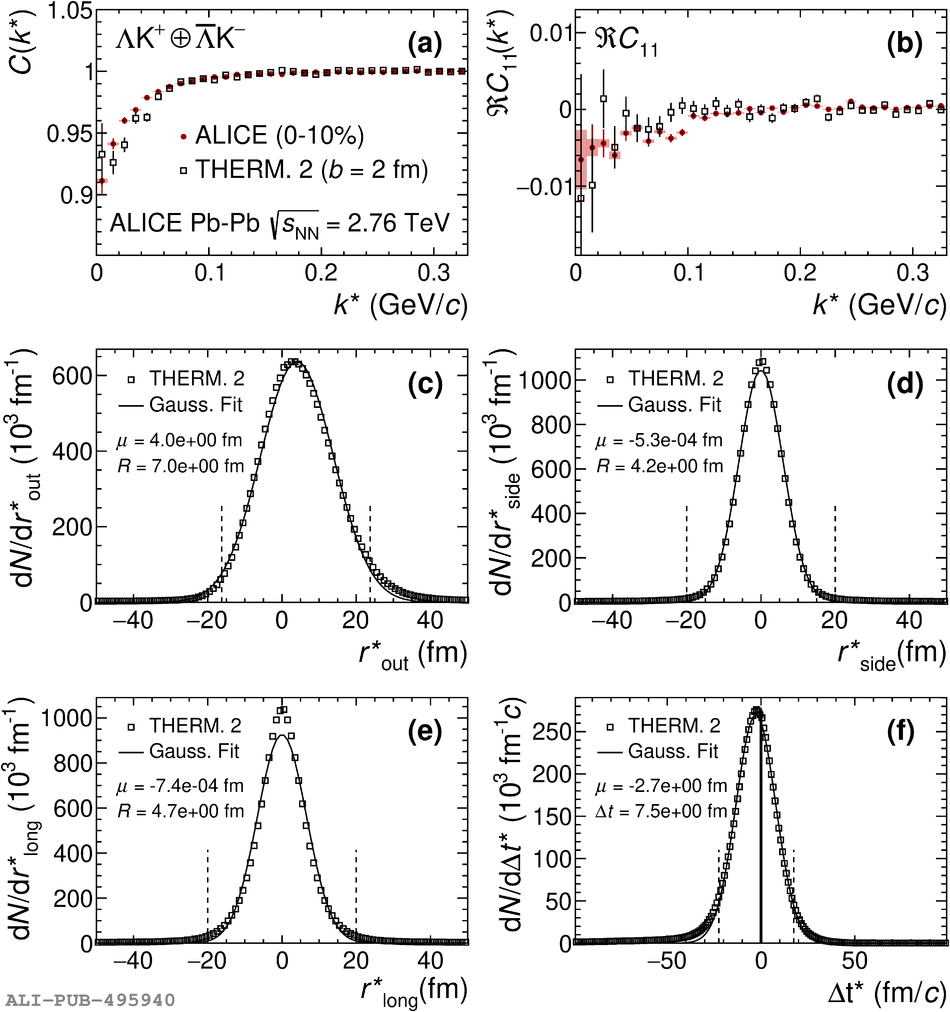 |