Invariant mass distributions in the 0--10\% centrality interval of (a) p$\uppi^{-}$ pairs showing the \Lam peak, and of (b) $\uppi^{+}\uppi^{-}$ pairs showing the \Ks peak, for \Vz candidates. The bottom panels are zoomed to show the background with fit. The vertical dashed (green) lines represent the selection restrictions used in the analyses, the vertical dotted (red) lines delineate the region over which the background was fit, and the dash-dotted (blue) line shows the background fit | 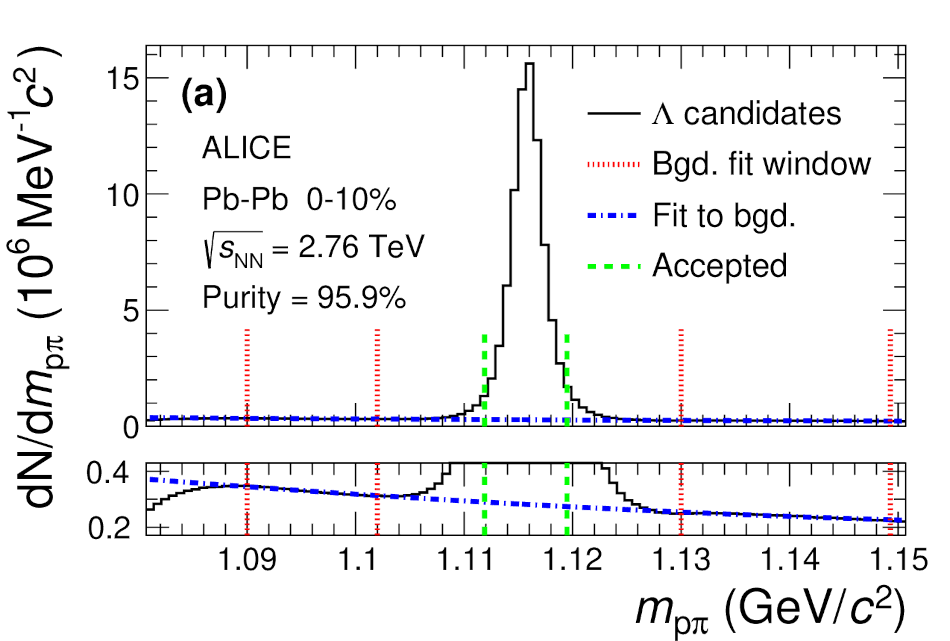  |