We report on the inclusive J/$\psi$ production cross section measured at the CERN Large Hadron Collider in proton-proton collisions at a centre-of-mass energy $\sqrt{s}~=~13$ TeV. The J/$\psi$ mesons are reconstructed in the $\rm e^{+} e^{-}$ decay channel and the measurements are performed at midrapidity ($|y|<~0.9$) in the transverse-momentum interval $0<~ p_{\rm T} <~40$ GeV/$c$, using a minimum-bias data sample corresponding to an integrated luminosity $L_{\text{int}} = 32.2~\text{nb}^{-1}$ and an Electromagnetic Calorimeter triggered data sample with $L_{\text{int}} = 8.3~\mathrm{pb}^{-1}$. The $p_{\rm T}$-integrated J/$\psi$ production cross section at midrapidity, computed using the minimum-bias data sample, is $\text{d}\sigma/\text{d}y|_{y=0} = 8.97\pm0.24~(\text{stat})\pm0.48~(\text{syst})\pm0.15~(\text{lumi})~\mu\text{b}$. An approximate logarithmic dependence with the collision energy is suggested by these results and available world data, in agreement with model predictions. The integrated and $p_{\rm T}$-differential measurements are compared with measurements in pp collisions at lower energies and with several recent phenomenological calculations based on the non-relativistic QCD and Color Evaporation models.
Eur. Phys. J. C 81 (2021) 1121
HEP Data
e-Print: arXiv:2108.01906 | PDF | inSPIRE
CERN-EP-2021-160
Figure group
Figure 1
Invariant-mass distributions for SE \ee pairs in two \ptee intervals from the MB event analysis (left panels) and two \ptee intervals from the EMCal-triggered event analysis (right panels). The signal and background components obtained from the fit procedure are shown separately. For the top-right panel, the distributions are scaled for convenience by a factor of 2. | 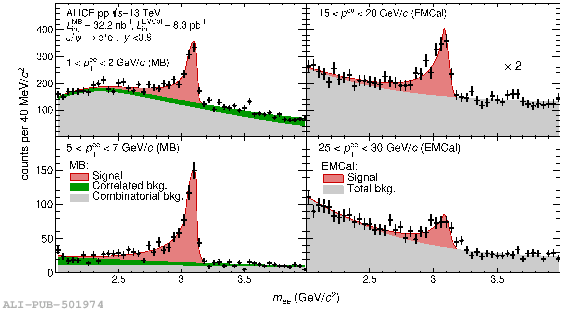 |
Figure 3
Inclusive \jpsi production cross section compared with calculations for the prompt \jpsi production cross section using ICEM , NLO NRQCD , LO NRQCD+CGC and for the non-prompt \jpsi from beauty-hadron feed-down using FONLL (left panel). Inclusive \jpsi production cross section compared with the corresponding calculations obtained as the sum of the prompt \jpsi component shown in the left panel and the non-prompt contribution from FONLL (right panel). The bottom panel shows the ratios between the model calculations and a fit to the data points. The bands illustrate the theoretical uncertainties centered around the ratio between the model calculation and the power-law fit to the data (see text for details). | 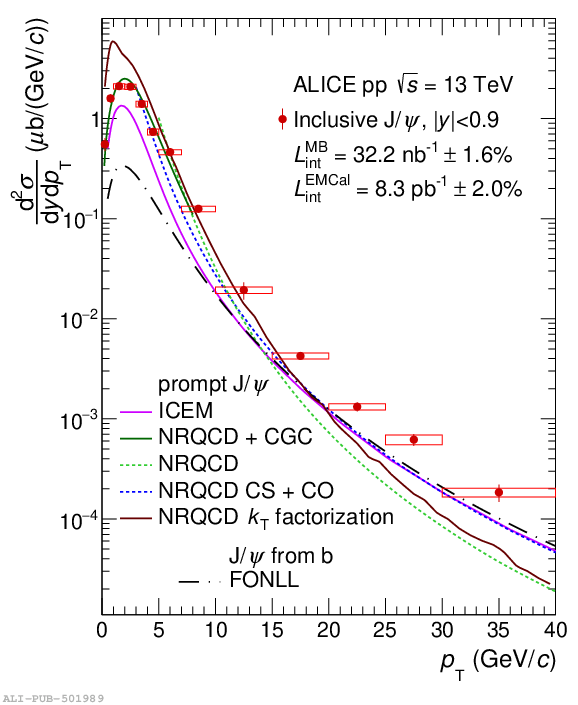 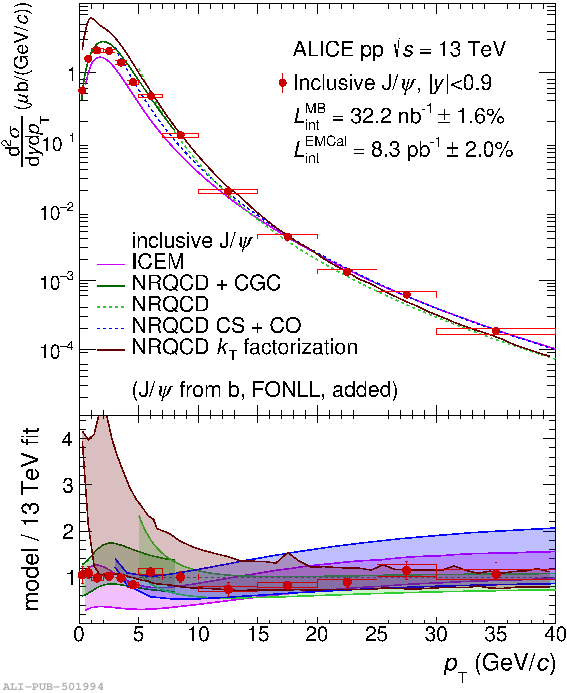 |
Figure 4
Inclusive \pt-integrated \jpsi production cross section as a function of collision energy (left panel) and rapidity (right panel) compared with the ICEM and NRQCD+CGC model calculations. The midrapidity \pt-integrated production cross section values are measured by the PHENIX , STAR , CDF and ALICE collaborations. The forward-rapidity production cross section shown in the right panel is reported by ALICE in Ref. | 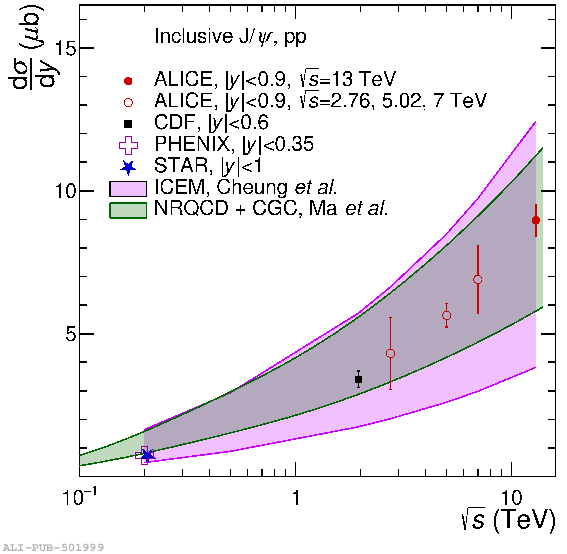 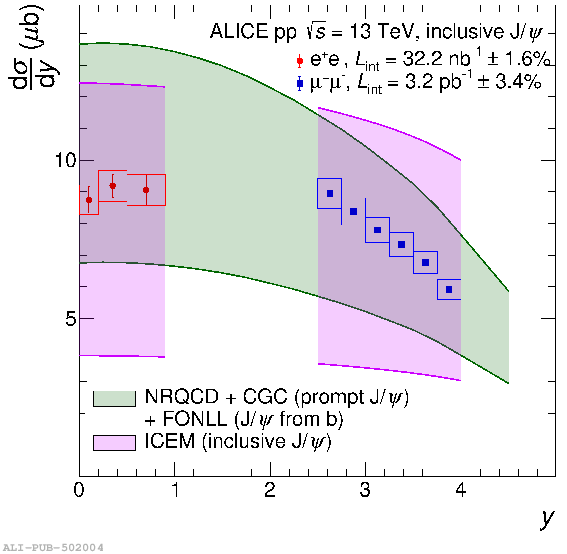 |