Raw primary \RatioAntip (left) and \RatioAntid (right) ratios as a function of the momentum $p_{\rm primary}$. Experimental data are shown in blue, the statistical and systematic uncertainties are shown as vertical bars and boxes. The results from ALICE MC simulations based on \geantf using the FTFP\_INCLXX\_EMV physics list are shown in black. The width of the MC band represents the statistical uncertainty of the simulation. The global uncertainty due to the primordial ratio (1.5\% for $\bar{\rm p}/\rm{p}$ and 3\% for $\bar{\rm d}/\rm{d}$) is not shown in the top panels. The bottom panels display the ratios of experimental data to MC simulations with statistical, systematic and global uncertainties added in quadrature. |  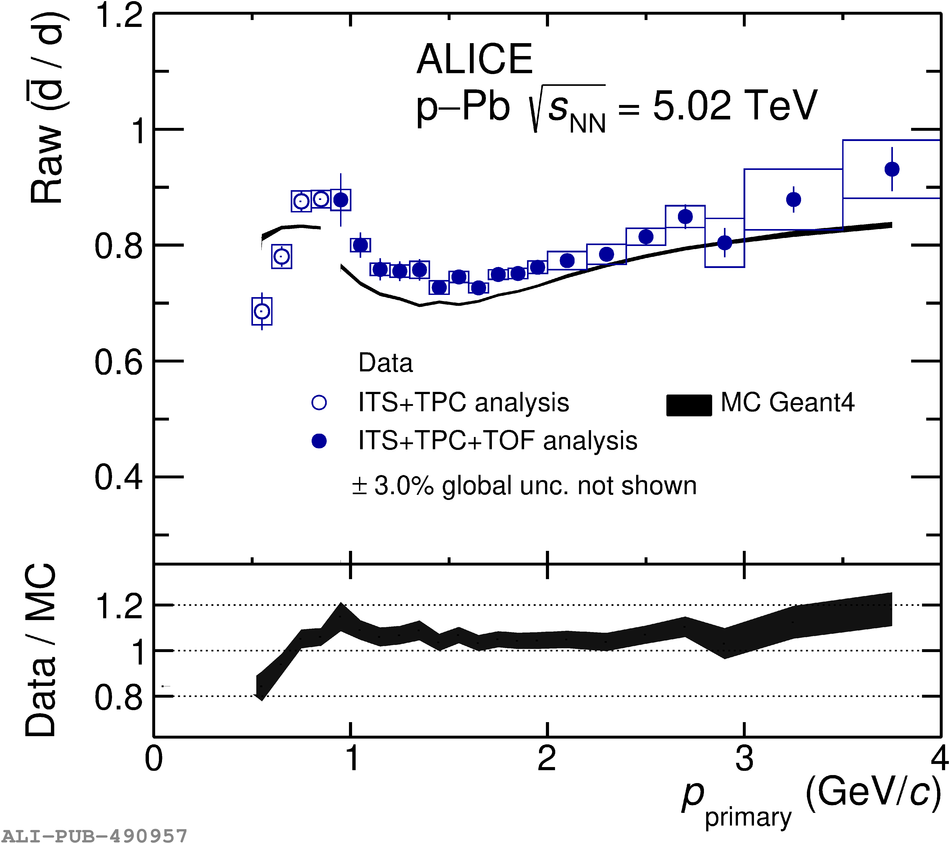 |