Invariant mass of $\pi^+\pi^-\pi^0$ candidates shown in the vicinity of the nominal mass of the $\omega$ meson for indicated \pT-ranges for $\pi^0$ reconstruction with PCM (left), EMC (middle) and PHOS (right) The second order polynomial used for the background description is shown with a band denoting the statistical uncertainties of the fit The points show the signal obtained after subtraction of the background fit The signal is fitted with a Gaussian, where the vertical lines indicate the integration range used to obtain the raw yield by bin-by-bin counting, as outlined in \Sect{sec:meson}. | 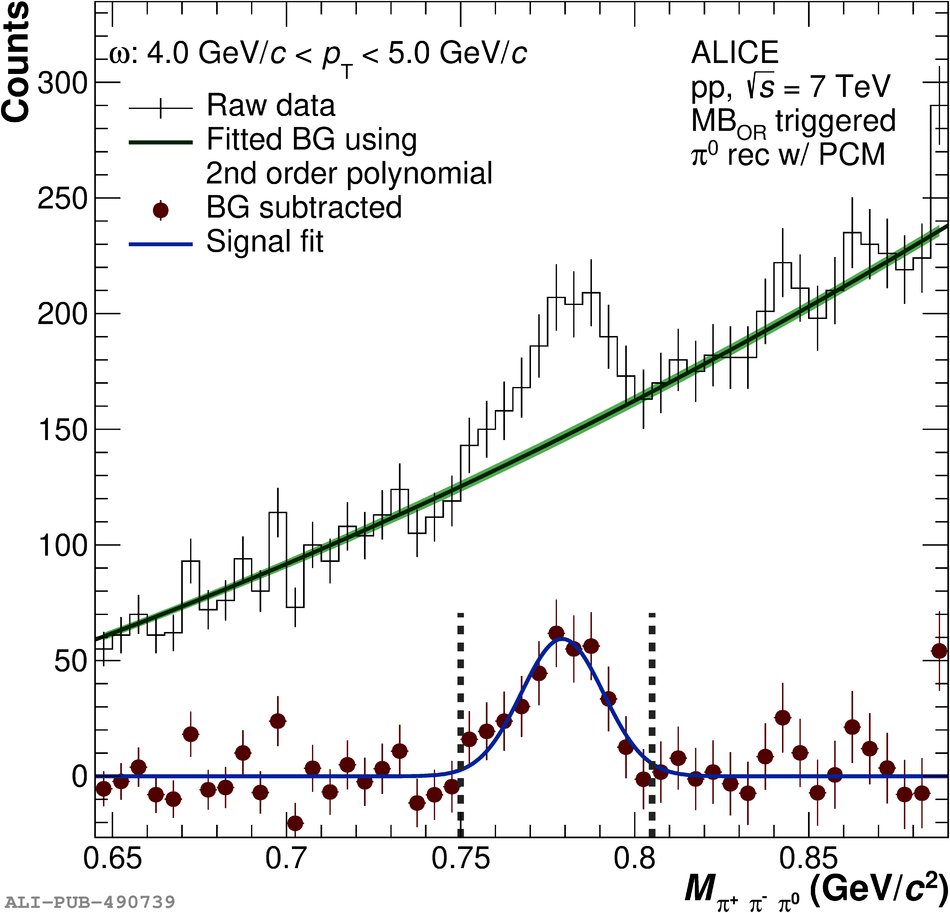 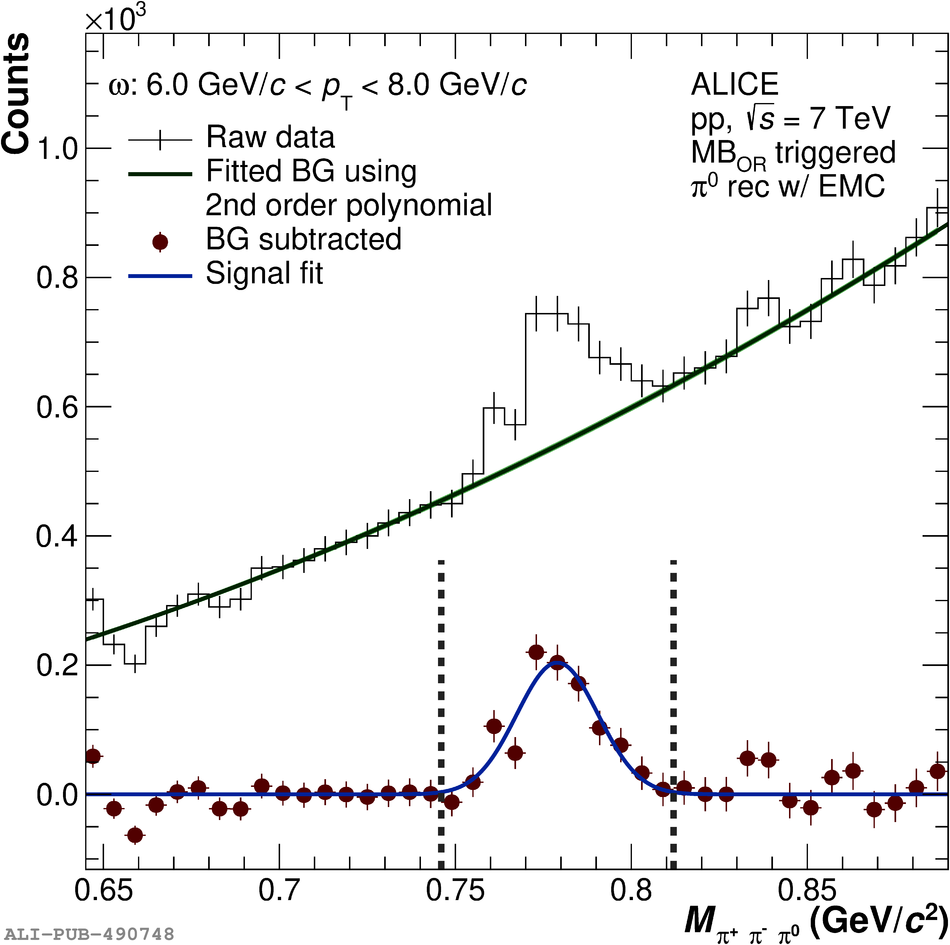  |