Elliptic (left panels) and triangular (right panels) flow of inclusive \jpsi , D mesons and charged pions as a function of \pt for the centrality intervals 0--10\% (top), 10--30\% (middle) and 30--50\% (bottom). The continuous curves show the calculated D-meson flow based on different values of the \pt fraction carried by the light quark (see text). The red dashed curves show the fits to the \jpsi \flown using ad-hoc functions (see text). | 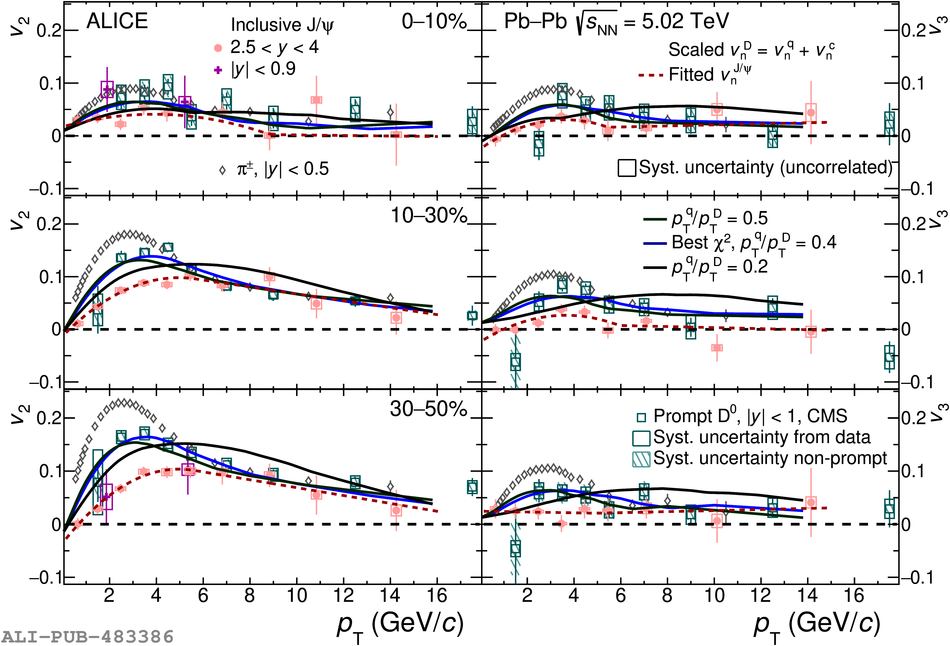 |