The correlation function of \pP (left) and \pL (right) as a function of \ks in one exemplary \mt interval. Statistical (bars) and systematic (boxes) uncertainties are shown separately. The filled bands depict $1\sigma$ uncertainties of the fits with $C_{\mathrm{\rm{fit}}}(\ks)$ and are obtained by using the Argonne $v_{18}$ (blue), $\chi$EFT LO (green) and $\chi$EFT NLO (red) potentials. See text for details. | 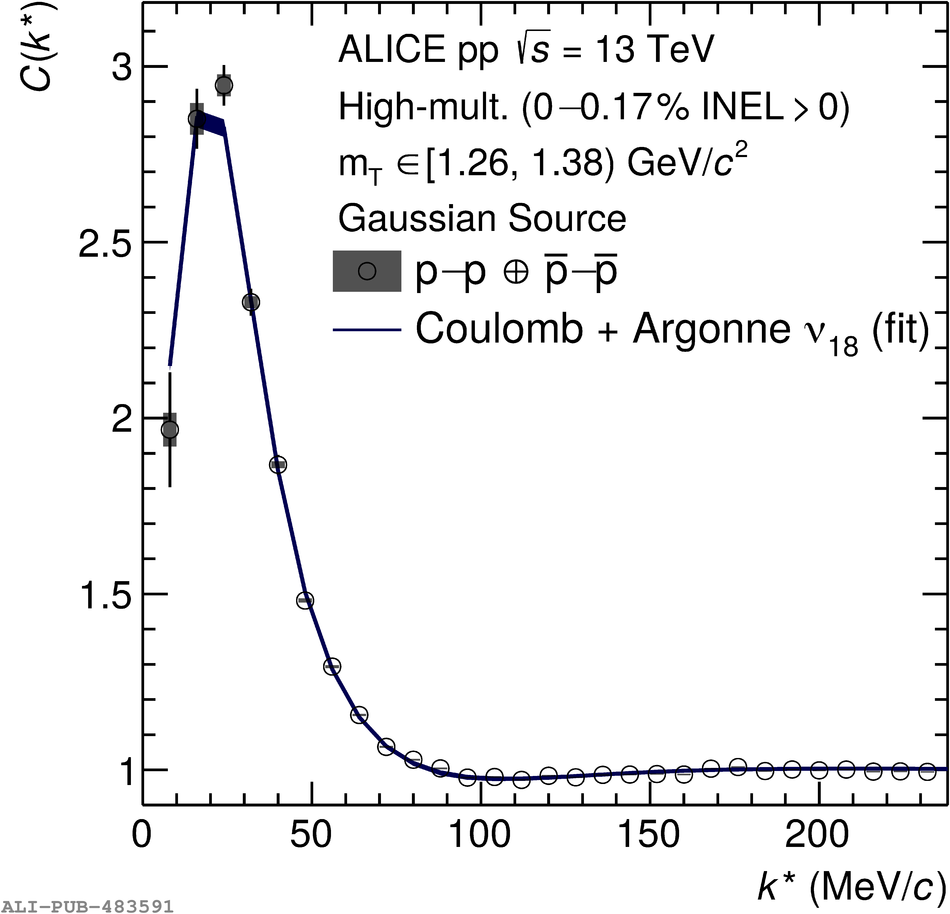 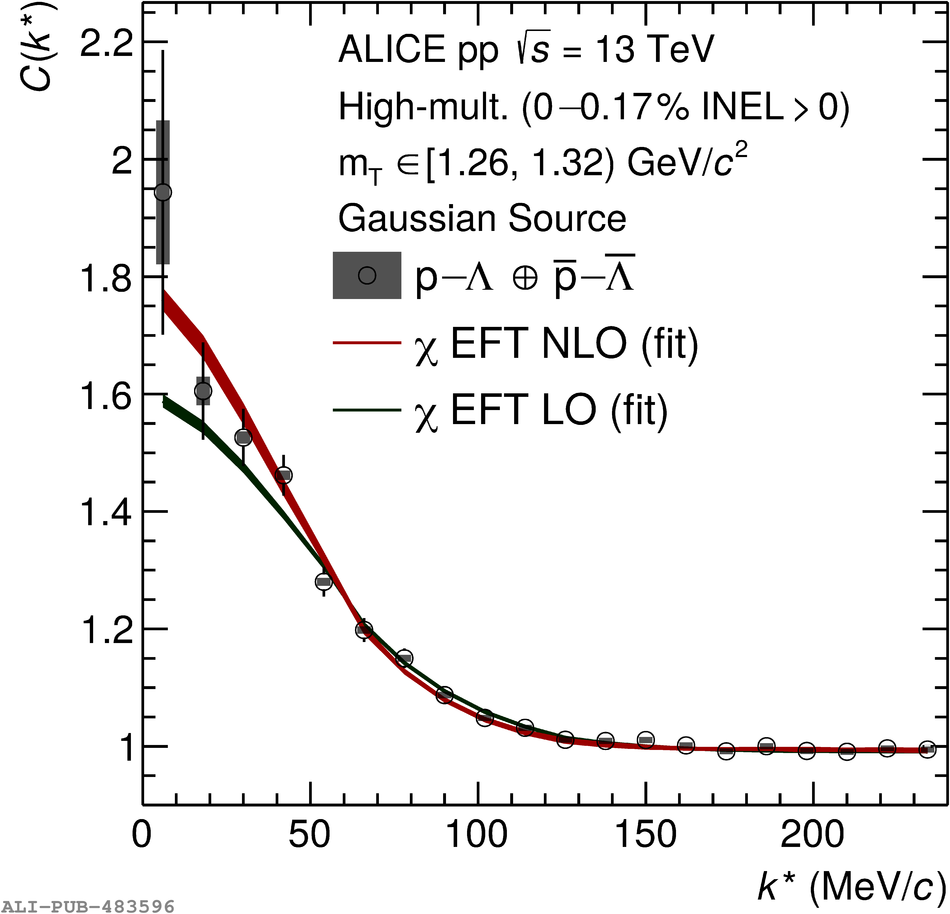 |