The $\XbarX$ ratio at $\sqrt{s} = 0.9$ TeV integrated over $|y|< $ 0.8 as a function of $\pt$. The data points are compared with different Monte Carlo generators. The vertical bars (boxes) represent the statistical (systematic) uncertainty, while the horizontal bars represent the width of the $\pt$ bin. Ratio of model to data is shown below using uncertainties added in quadrature. | 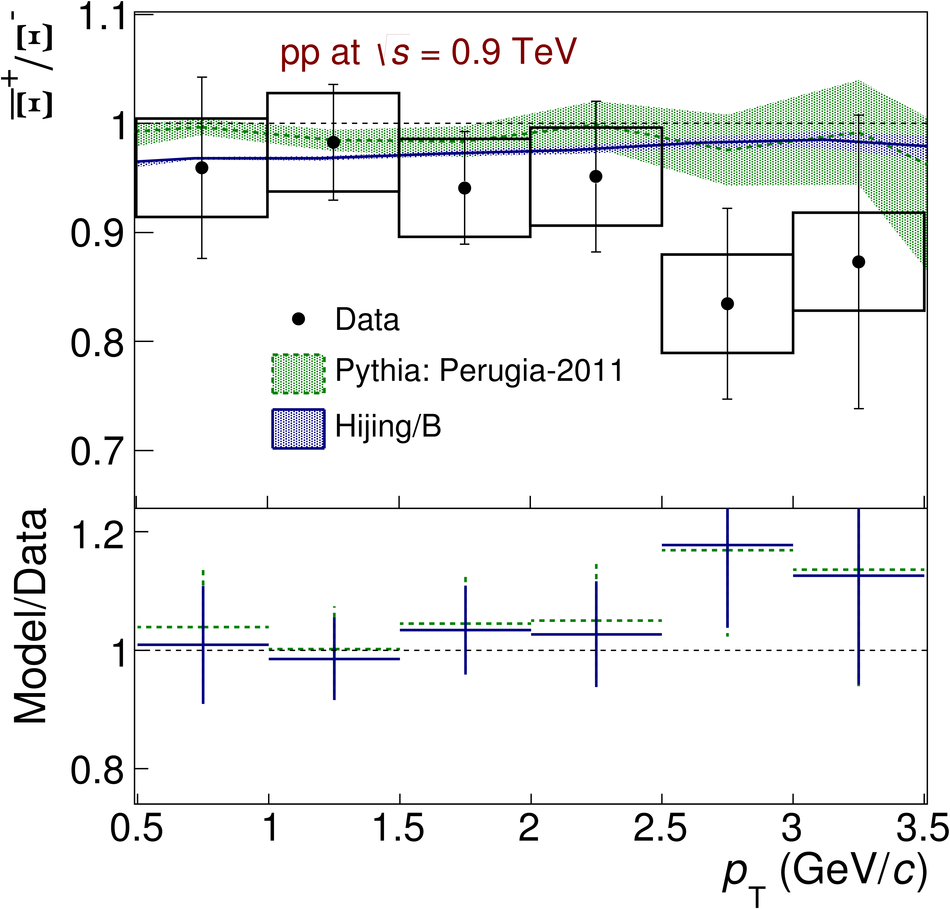 |