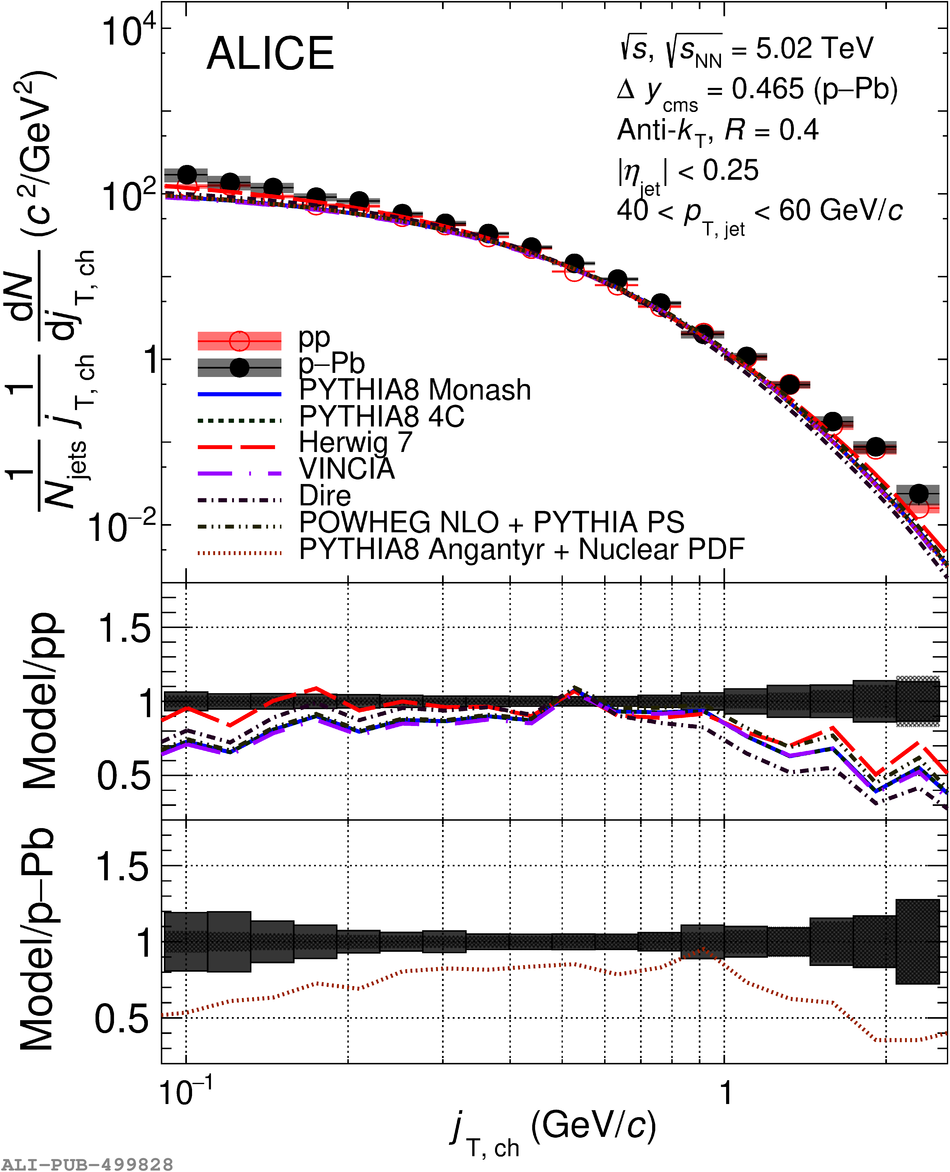
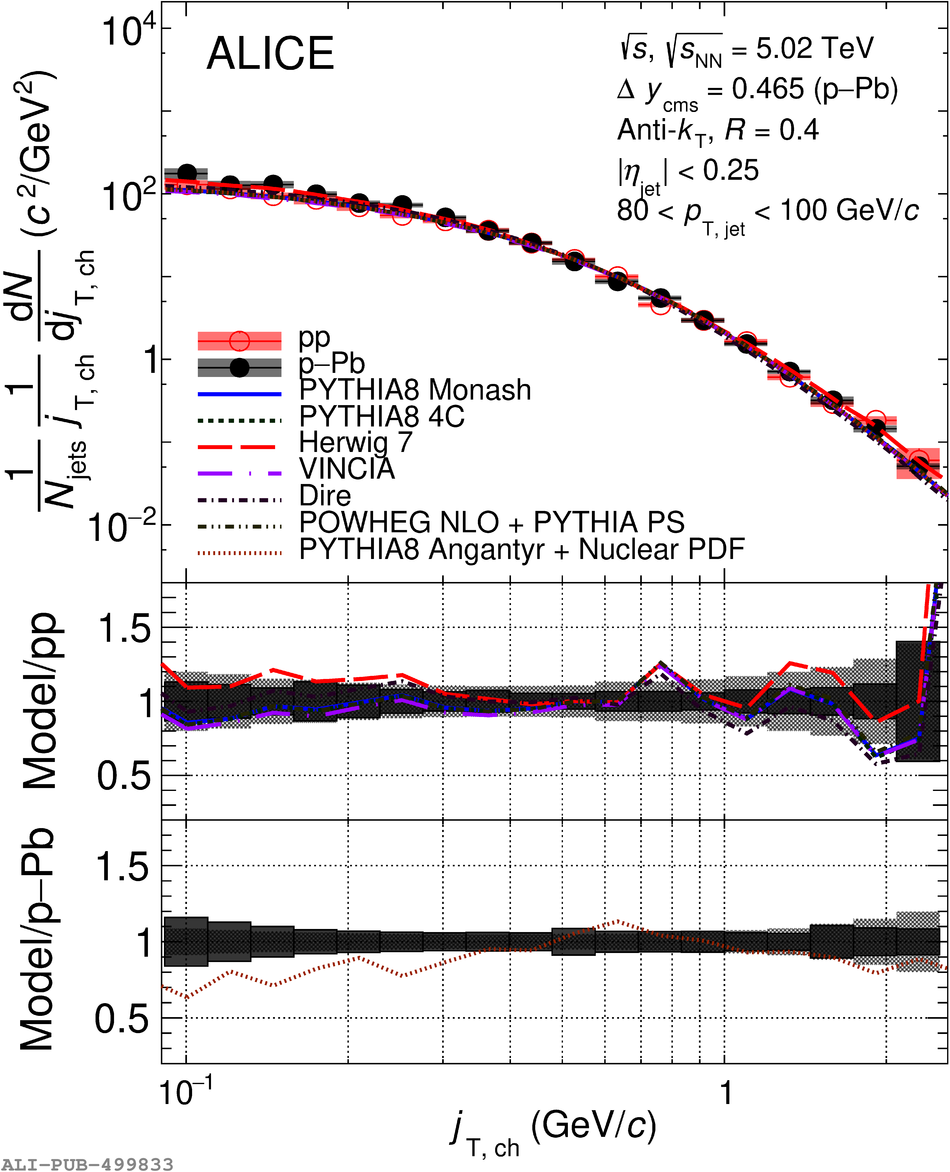
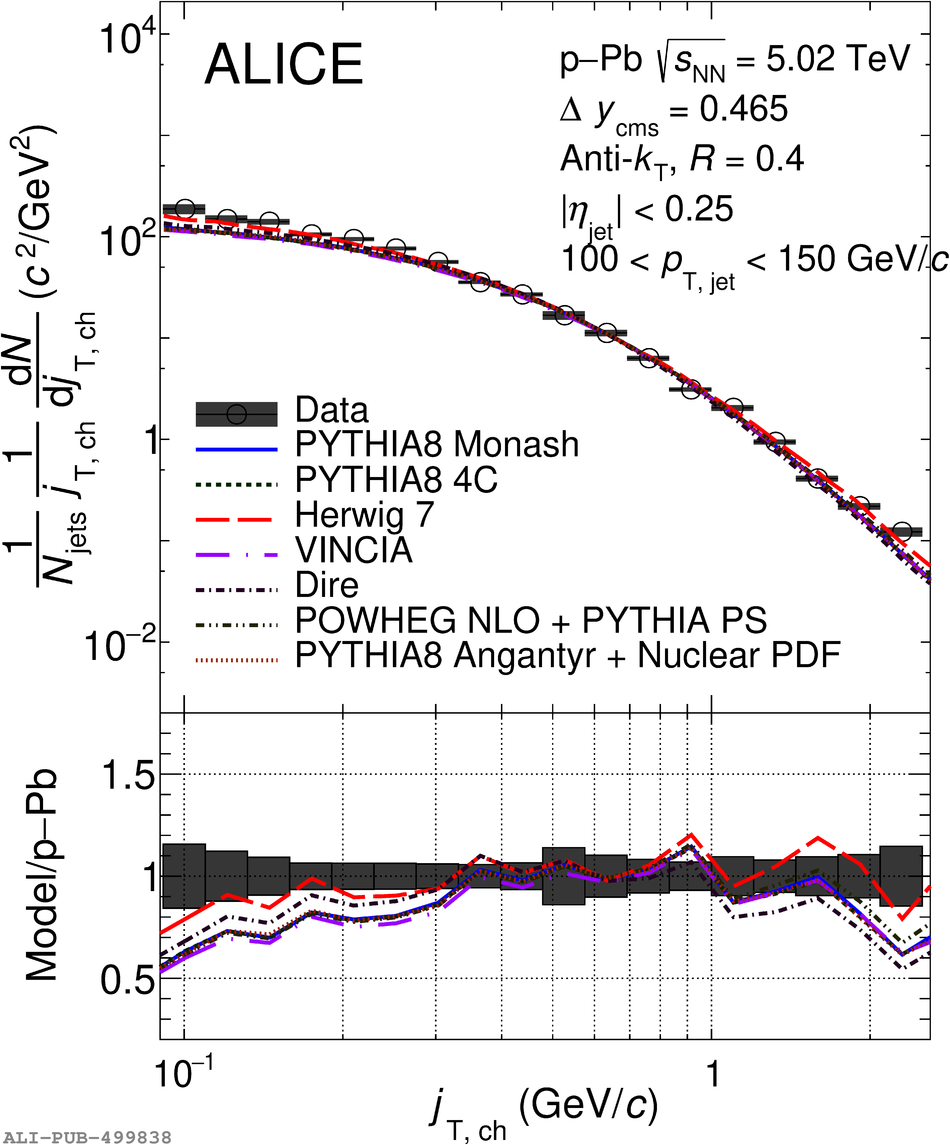
Jet fragmentation transverse momentum ($j_{\rm T}$) distributions are measured in proton-proton (pp) and proton-lead (p-Pb) collisions at $\sqrt{s_{\rm NN}}$ = 5.02 TeV with the ALICE experiment at the LHC. Jets are reconstructed with the ALICE tracking detectors and electromagnetic calorimeter using the anti-$k_{\rm T}$ algorithm with resolution parameter $R=0.4$ in the pseudorapidity range $|\eta|<~0.25$. The $j_{\rm T}$ values are calculated for charged particles inside a fixed cone with a radius $R = 0.4$ around the reconstructed jet axis. The measured $j_{\rm T}$ distributions are compared with a variety of parton-shower models. Herwig and PYTHIA 8 based models describe the data well for the higher $j_{\rm T}$ region, while they underestimate the lower $j_{\rm T}$ region. The $j_{\rm T}$ distributions are further characterised by fitting them with a function composed of an inverse gamma function for higher $j_{\rm T}$ values (called the "wide component"), related to the perturbative component of the fragmentation process, and with a Gaussian for lower $j_{\rm T}$ values (called the "narrow component"), predominantly connected to the hadronisation process. The width of the Gaussian has only a weak dependence on jet transverse momentum, while that of the inverse gamma function increases with increasing jet transverse momentum. For the narrow component, the measured trends are successfully described by all models except for Herwig. For the wide component, Herwig and PYTHIA 8 based models slightly underestimate the data for the higher jet transverse momentum region. These measurements set constraints on models of jet fragmentation and hadronisation.
JHEP09 (2021) 211
HEP Data
e-Print: arXiv:2011.05904 | PDF | inSPIRE
CERN-EP-2020-220
Figure group
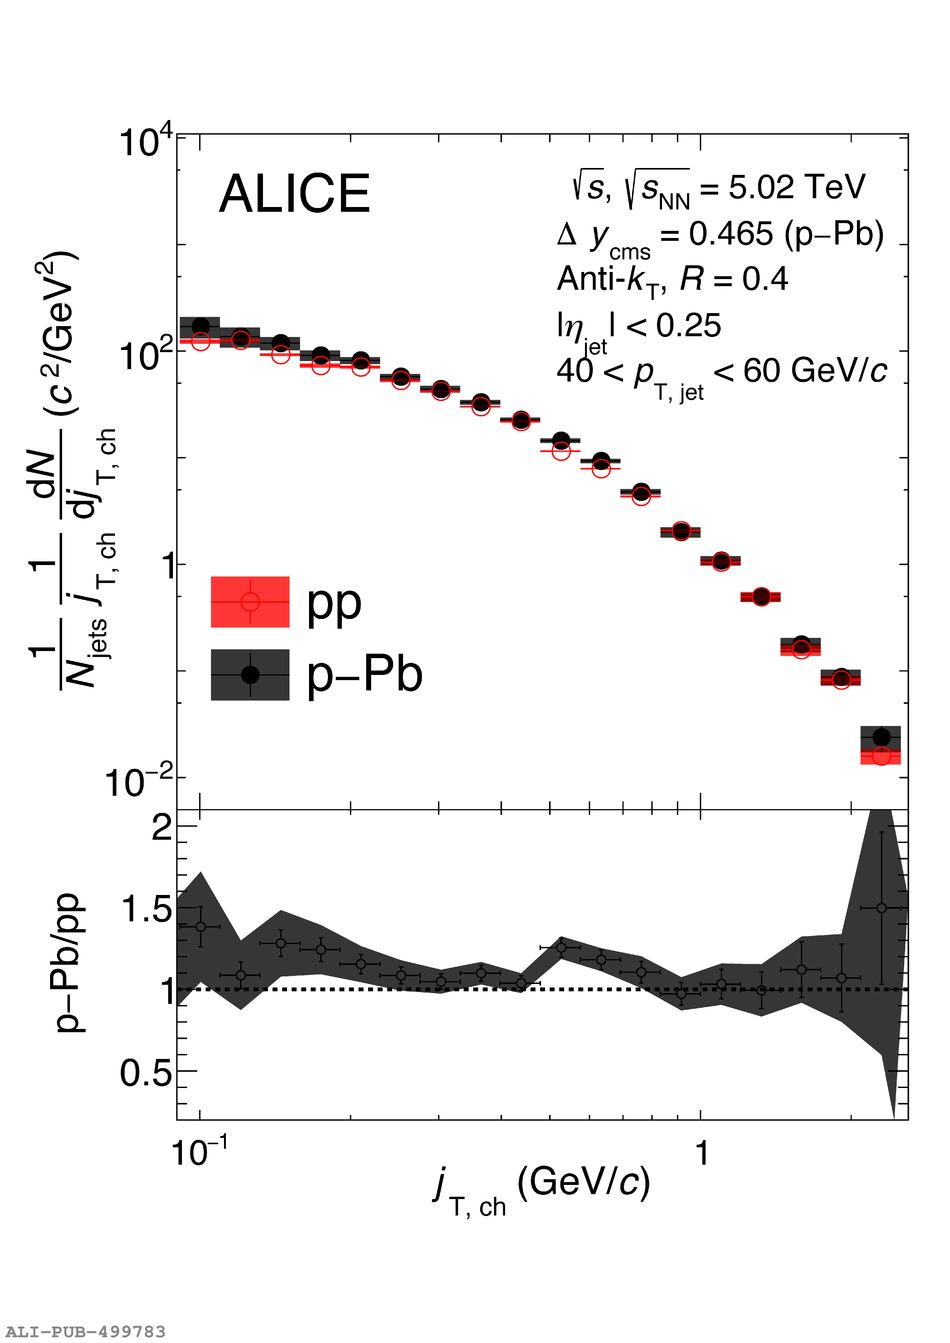
Figure 2
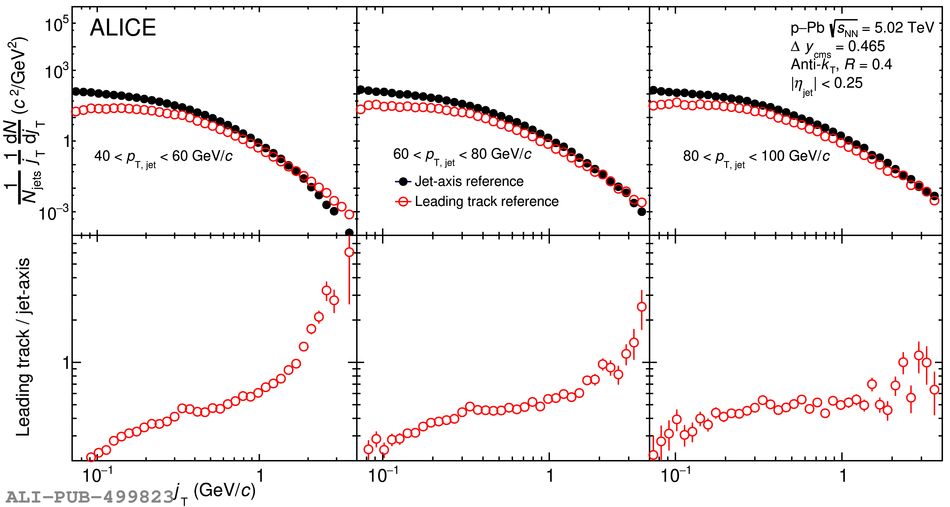
The $\jt$ distributions of charged particles in $R = 0.4$ anti-$k_\mathrm{T}$ jets as measured in $\pPb$ collisions at $\sqrtSnnE{5.02}$ for different ranges of $\ptjet$. The centre-of-mass rapidity is shifted by $\Delta y = 0.465$ in the direction of the proton beam. The bottom panel shows ratios of the $\jt$ distributions with respect to that in \unit[$40 | 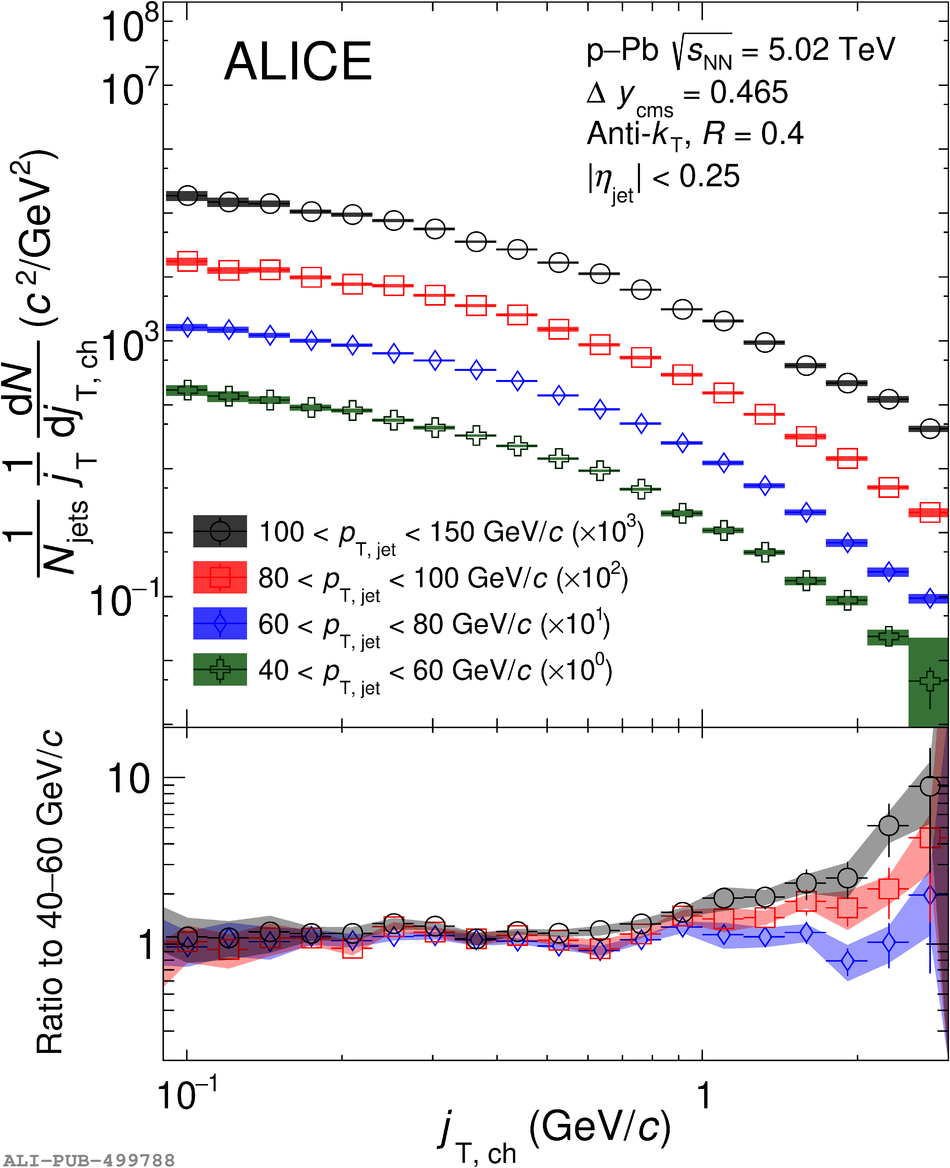 |
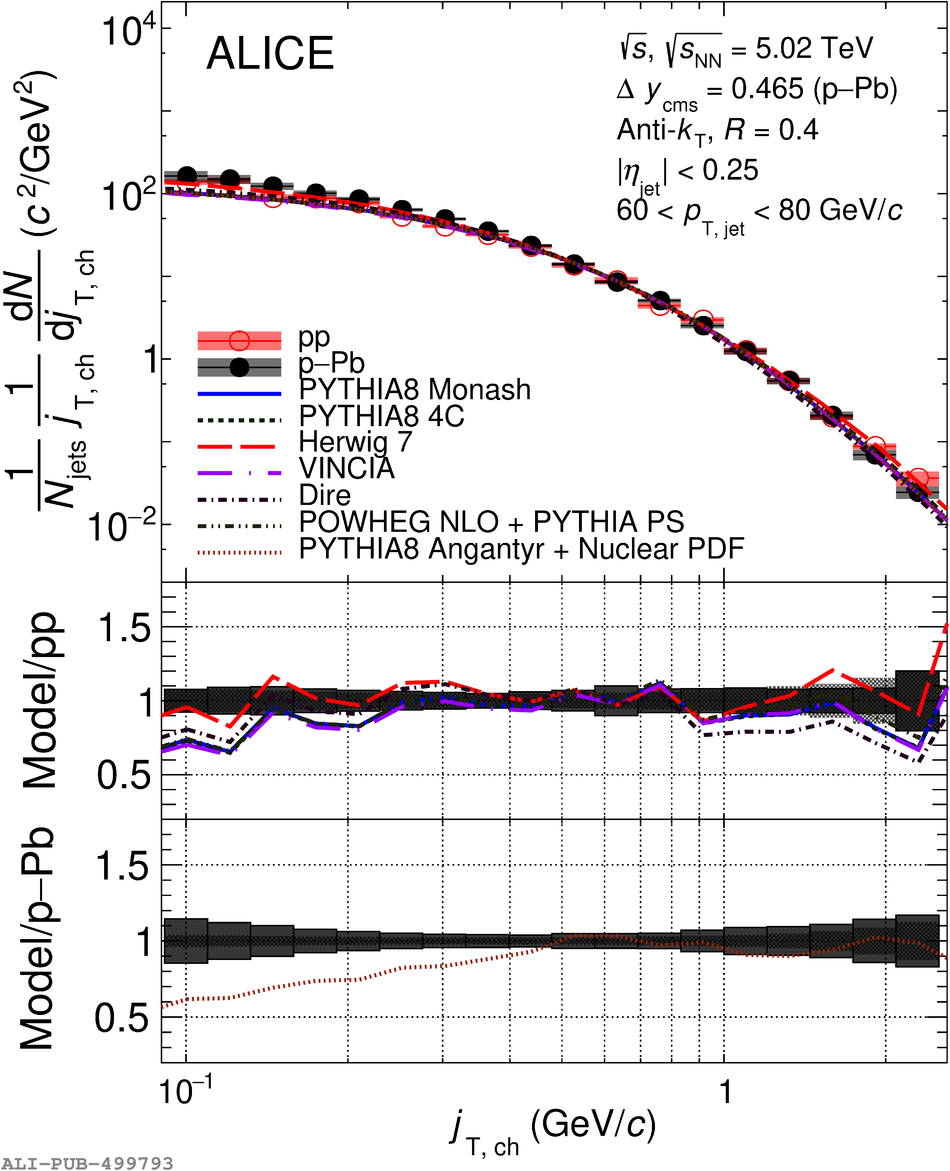
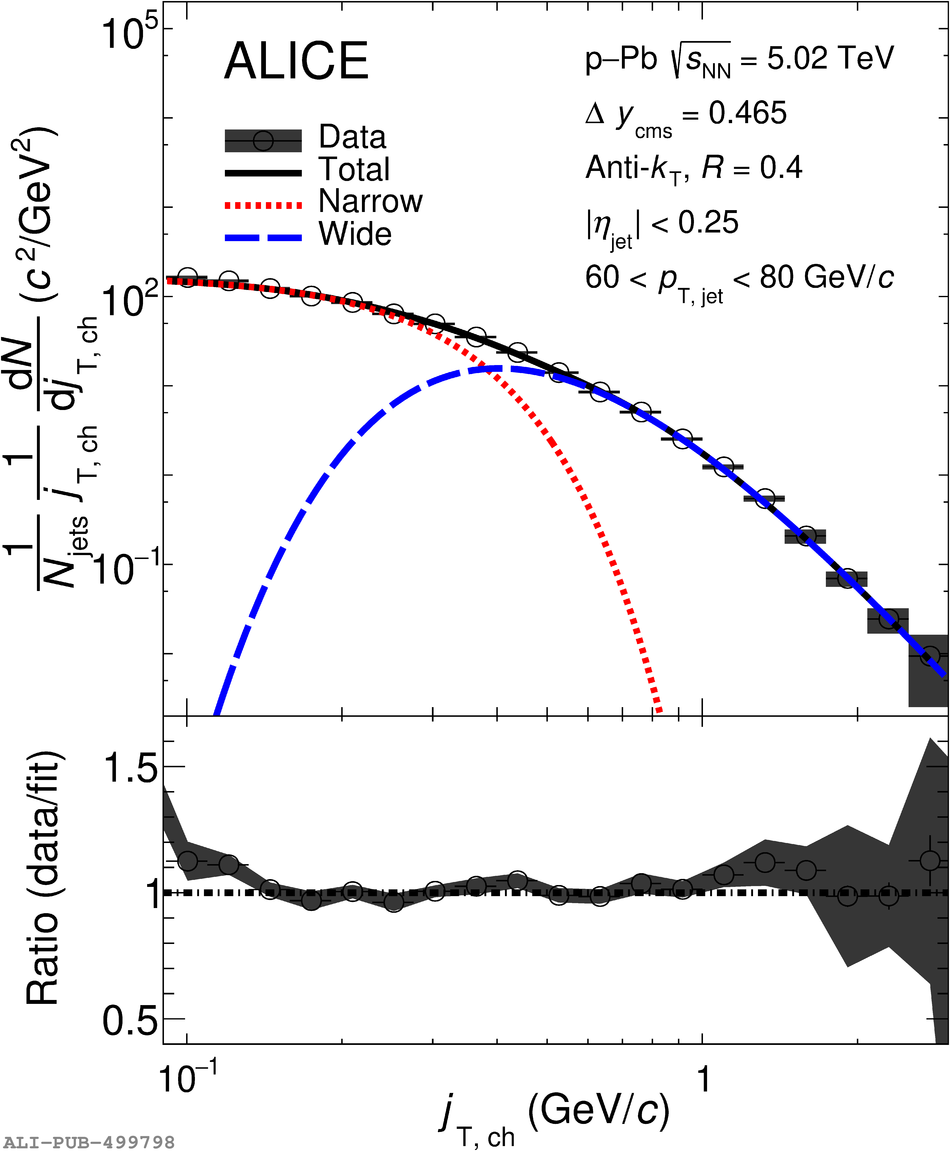
Figure 5
RMS values extracted from the fits for the Gaussian (narrow) and inverse gamma (wide) components. The middle and bottom plots show ratios of models to data for the wide and narrow components, respectively. The grey filled bands with (without) a hatched line in the ratio plots represent the statistical (systematic) uncertainties of the p--Pb data. Note that pp data points are shifted by -2 GeV/$c$ on the horizontal axis to be distinguished from p--Pb data points. |  |
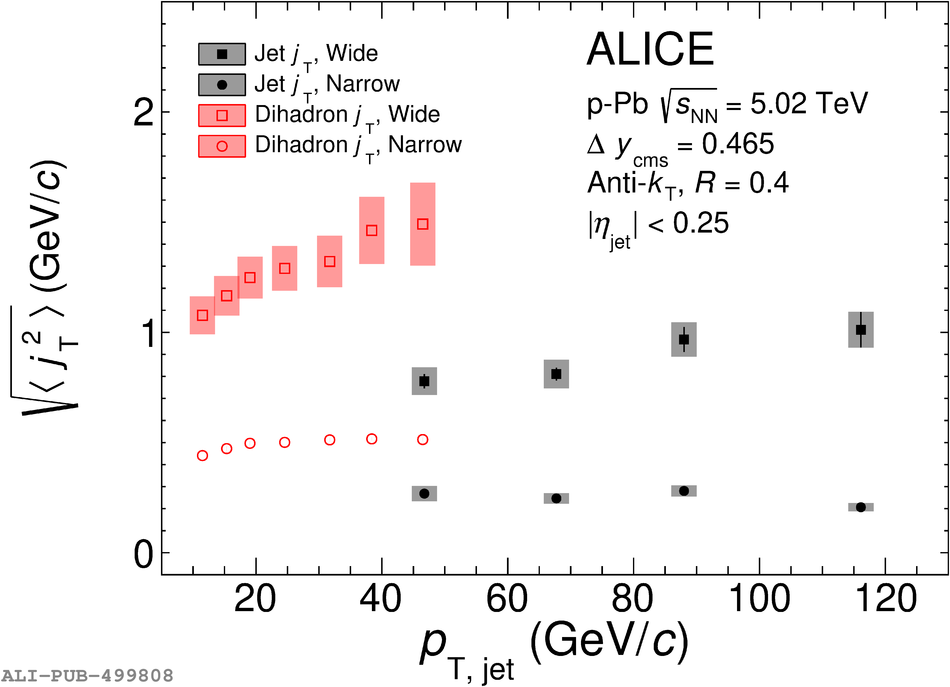
Figure 7
The effect of changing the $R$ parameter in jet finding on $\jt$ distributions obtained with PYTHIA 8 simulations. Comparison of (a) $\jt$ signal distributions for different $R$ parameters and their ratios to that of $R=0.3$ and (b) RMS values of the wide and narrow components and their ratios to that of $R=0.3$ for the wide component only. | 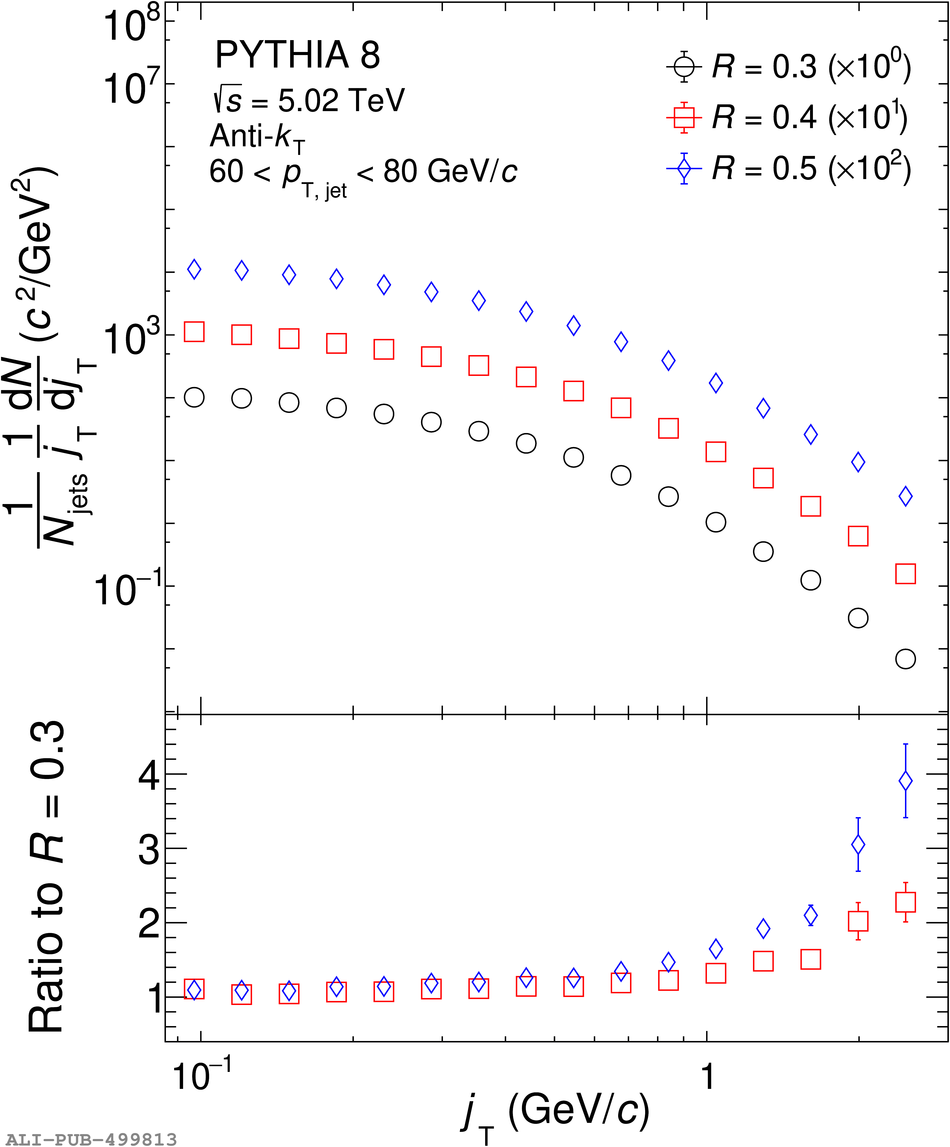 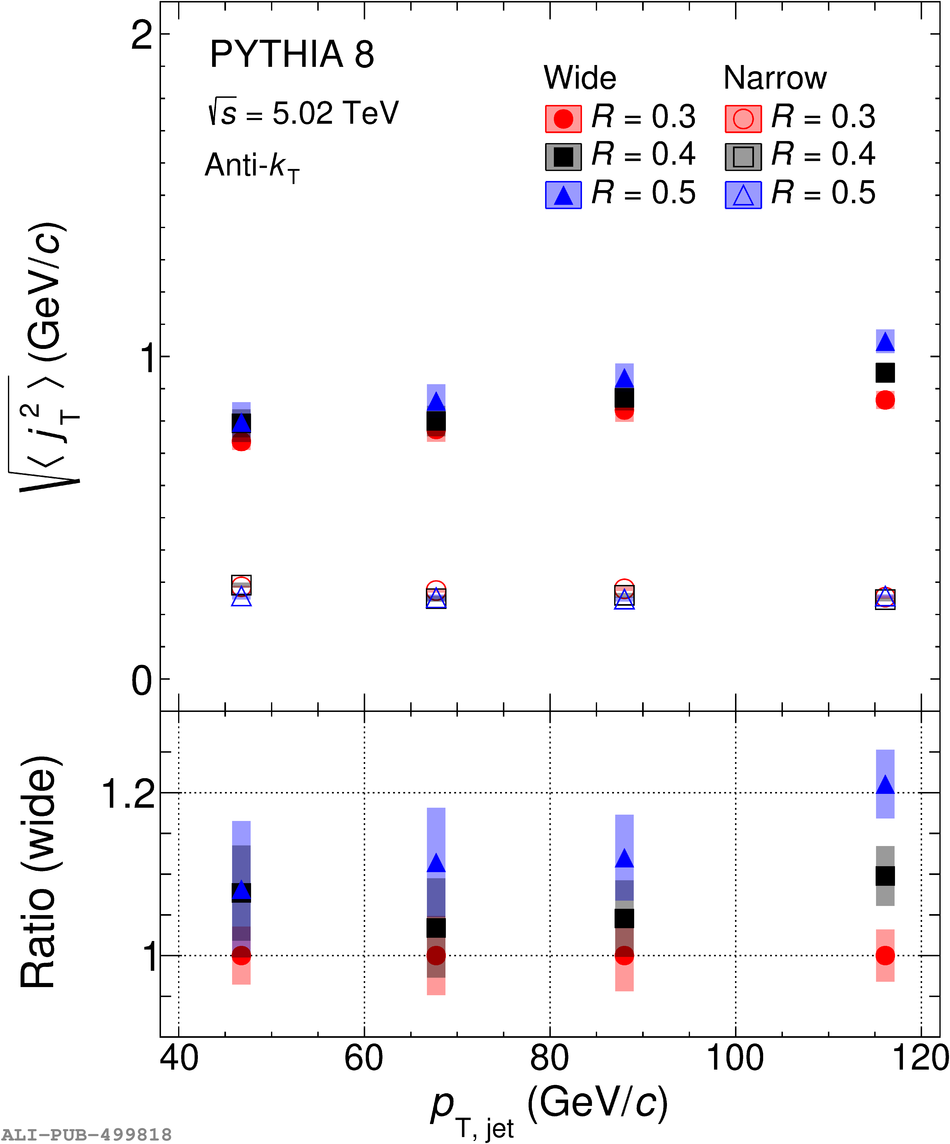 |