The ratio of individual spectra to the combined spectrum as a function of $\pt$ for pions (top), kaons (center), and protons (bottom). Only the $\pt$-range where the analyses overlap is shown. The ITS+TPC+TOF spectra are the results published in $Phys.Rev.C88,044910(2013)$. The statistical and independent systematic uncertainties are shown as vertical error bars and as a band, respectively, and only include those on the individual spectra. | 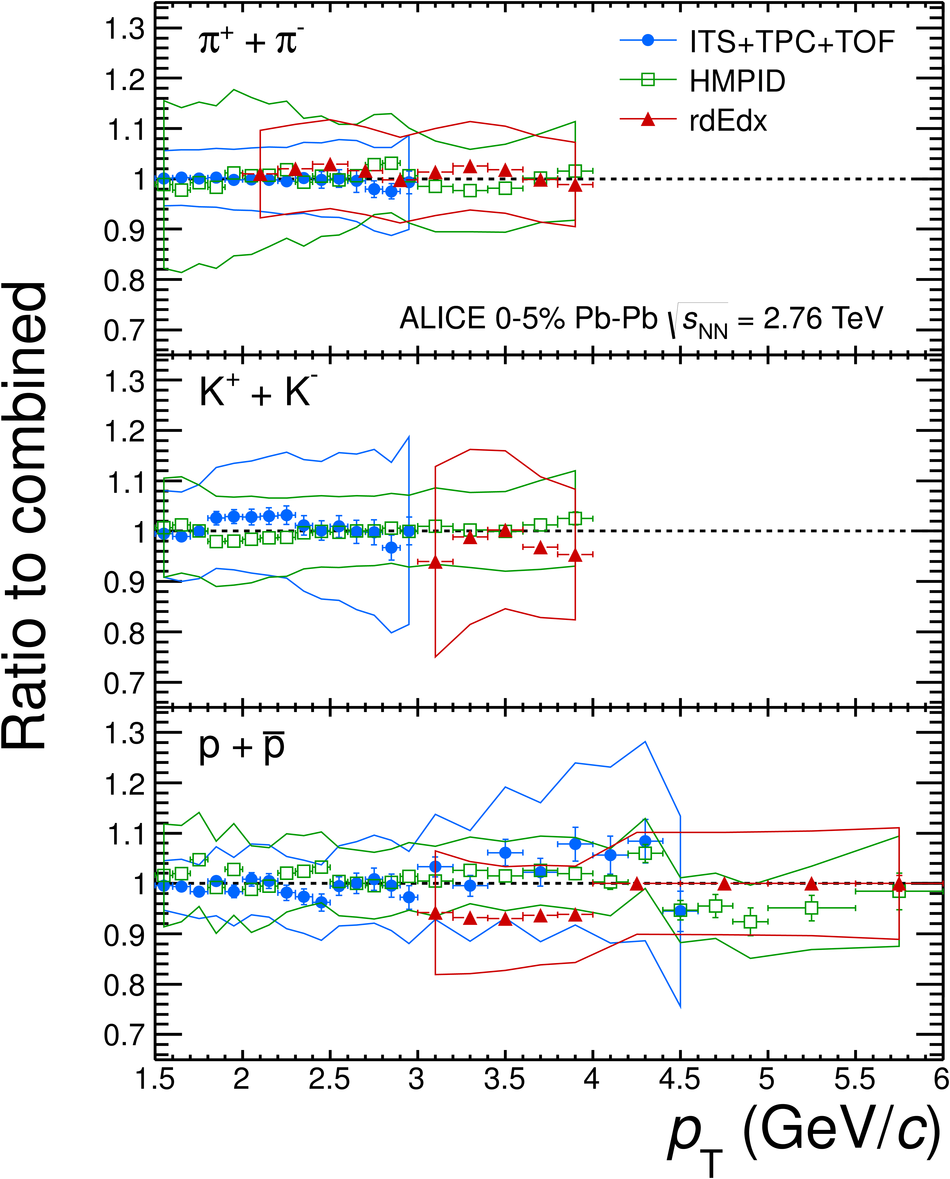 |