(Multi-)strange particle production rates and transverse momentum distributions are measured at midrapidity ($|y| <~ 0.5$) as a function of the charged-particle multiplicity density by the ALICE experiment at the LHC, using proton-proton collisions at a center-of-mass energy of ${\bf \sqrt{s}~=~5.02}$~TeV. This study extends similar studies performed at ${\bf \sqrt{s}~=~7}$~TeV and ${\bf \sqrt{s}~=~13}$~TeV to a lower energy regime, improving the statistical precision and extending the measurement to previously unexplored low-multiplicity regions. While $K_S^0$, $Λ$, and $Ξ$ yields can be described with a linear multiplicity dependence within uncertainties, the $Ω$ yields follow a significantly faster than linear increasing trend. For all analyzed particles, the overall production rate is consistent with those observed at higher energy and at similar multiplicity densities. Transverse momentum distributions are observed to evolve with multiplicity. Several state-of-the-art QCD-inspired Monte Carlo models have been compared to the data, testing some recently introduced features to address the findings at higher energies. Models can qualitatively describe the transverse momentum spectra and the $Λ/K_S^0$ spectral ratio only if collectivity is introduced in the evolution of the system.
Accepted by: PRC
HEP Data
e-Print: arXiv:2511.10306 | PDF | inSPIRE
CERN-EP-2025-256
Figure group
Figure 1
\pt distributions at midrapidity for \kzero, \lmb, \Xiboth, and \Omboth for multiplicity classes and \inelgz, as indicated. Statistical uncertainties are shown as error bars, the systematic ones as boxes. The bottom panels present the ratio of all spectra to the \inelgz one. The dashed curves show the Levy-Tsallis fit to the \pt distributions. | 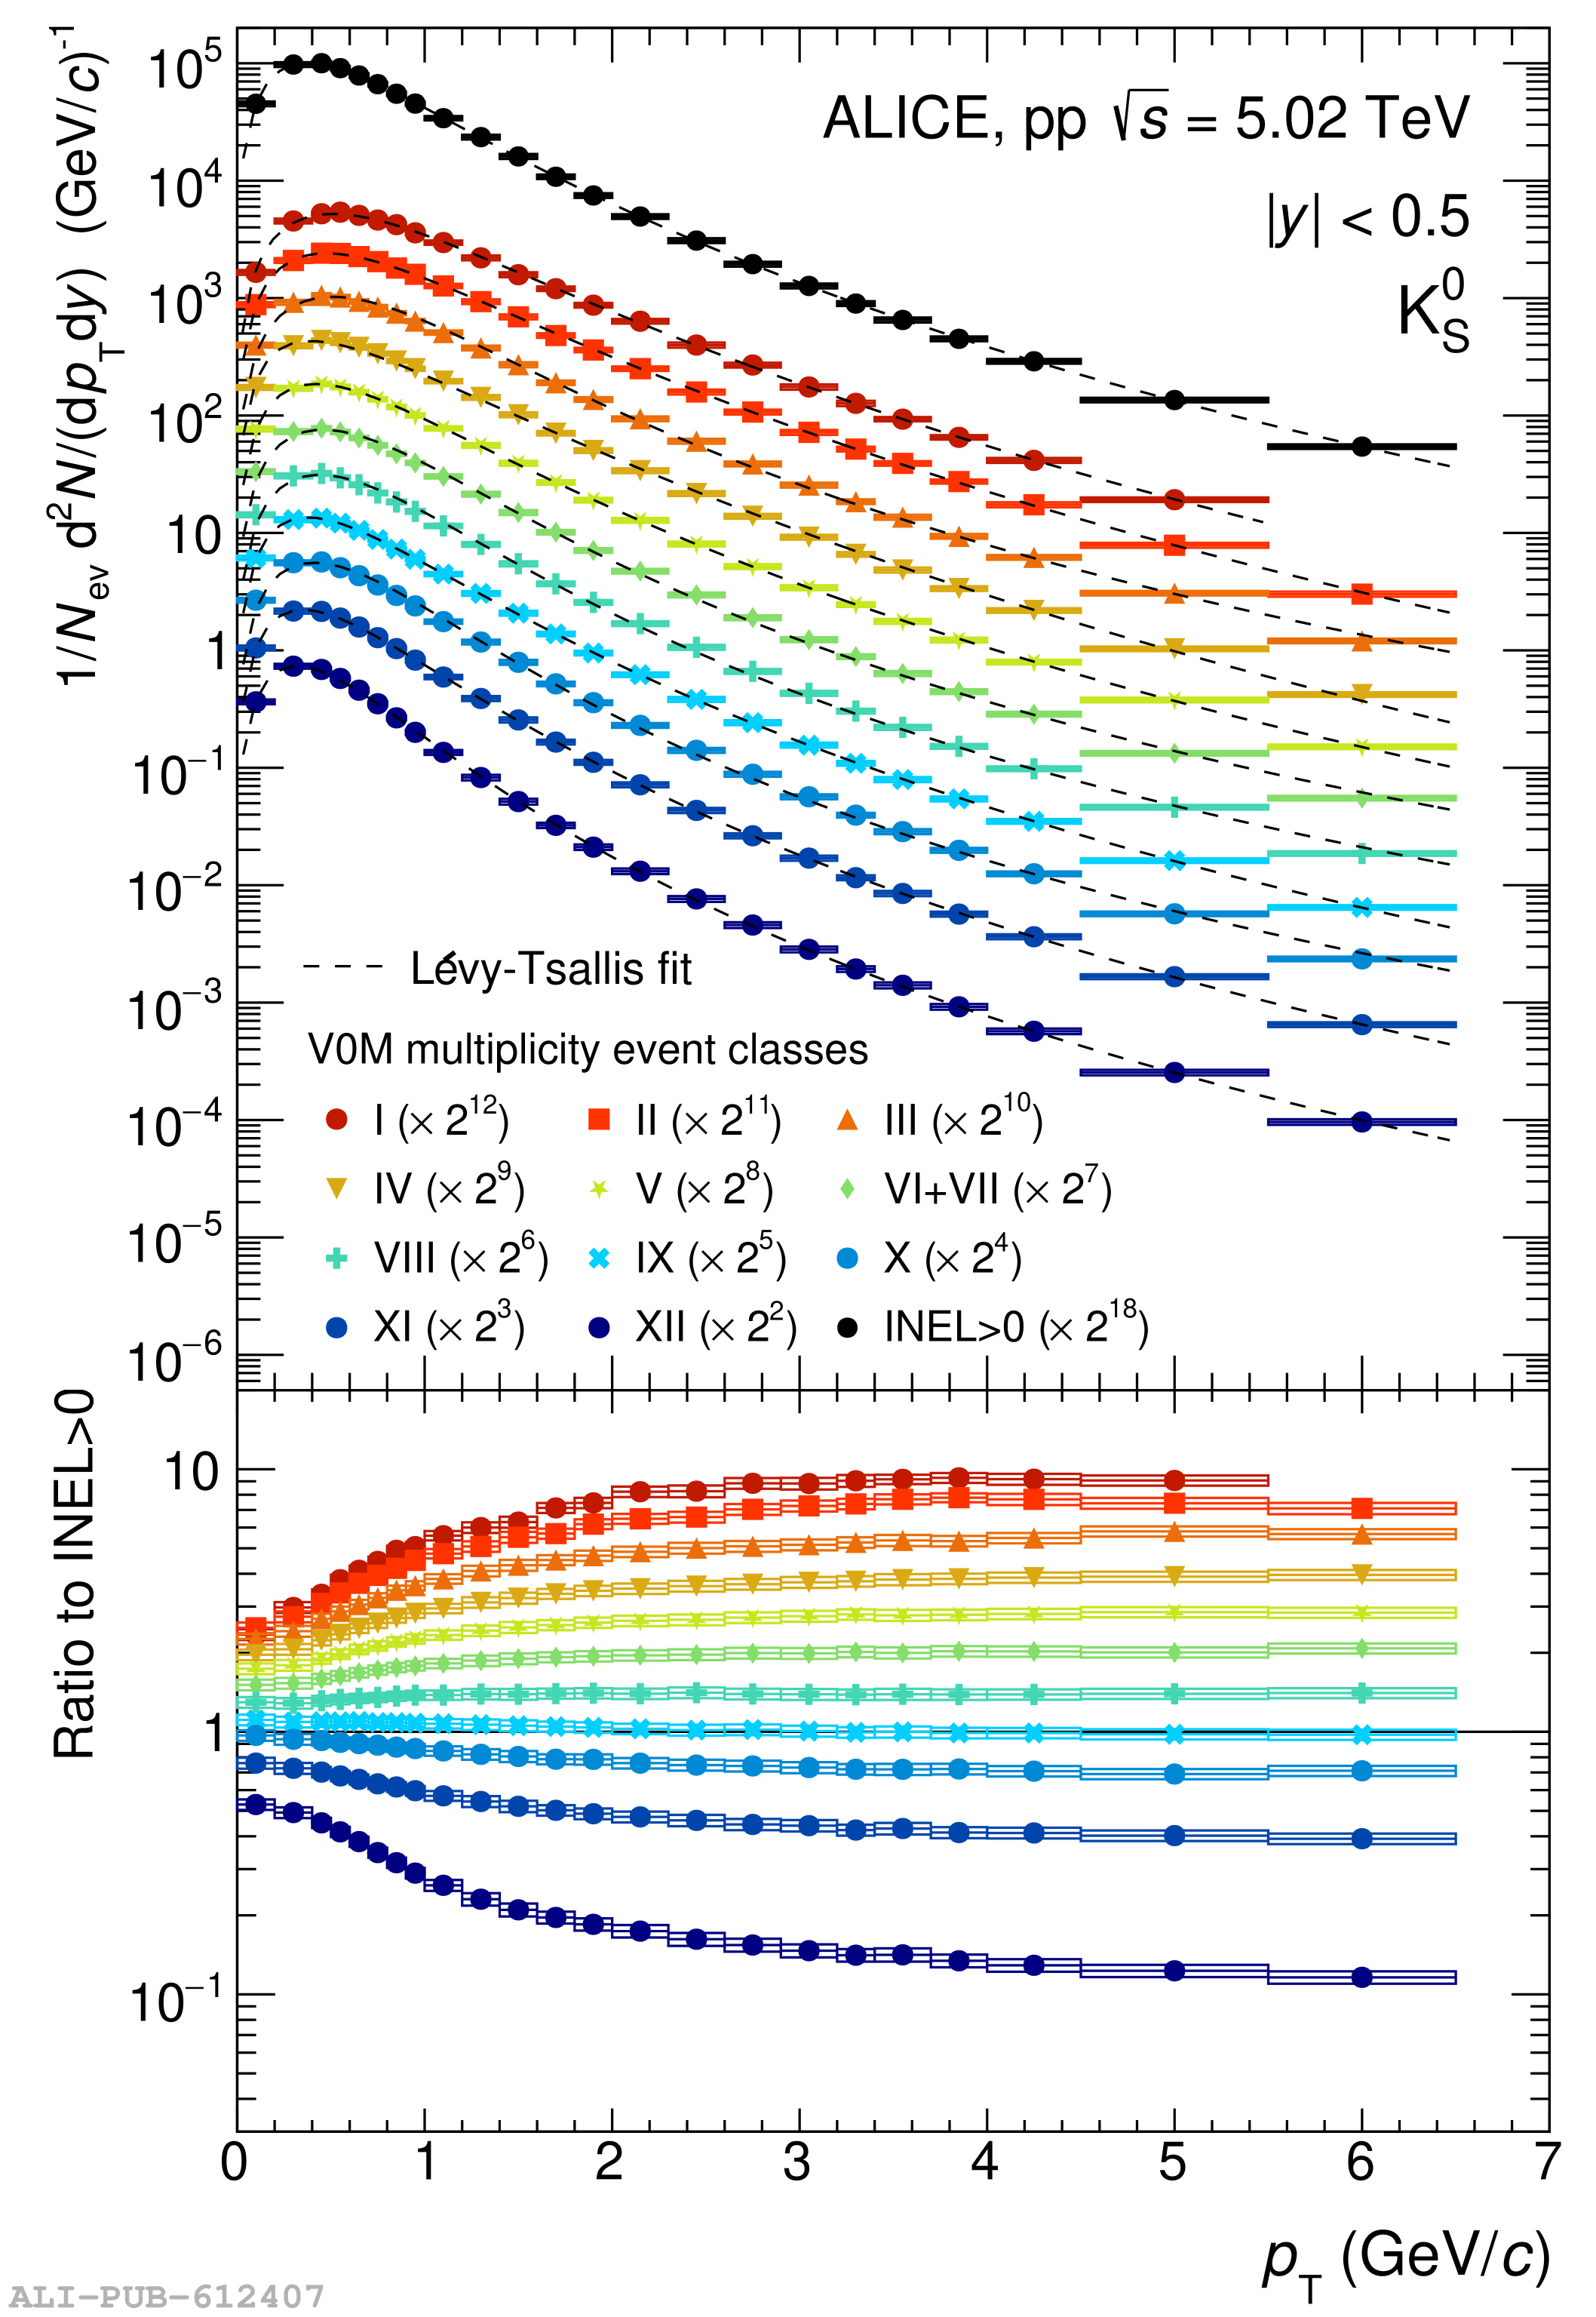 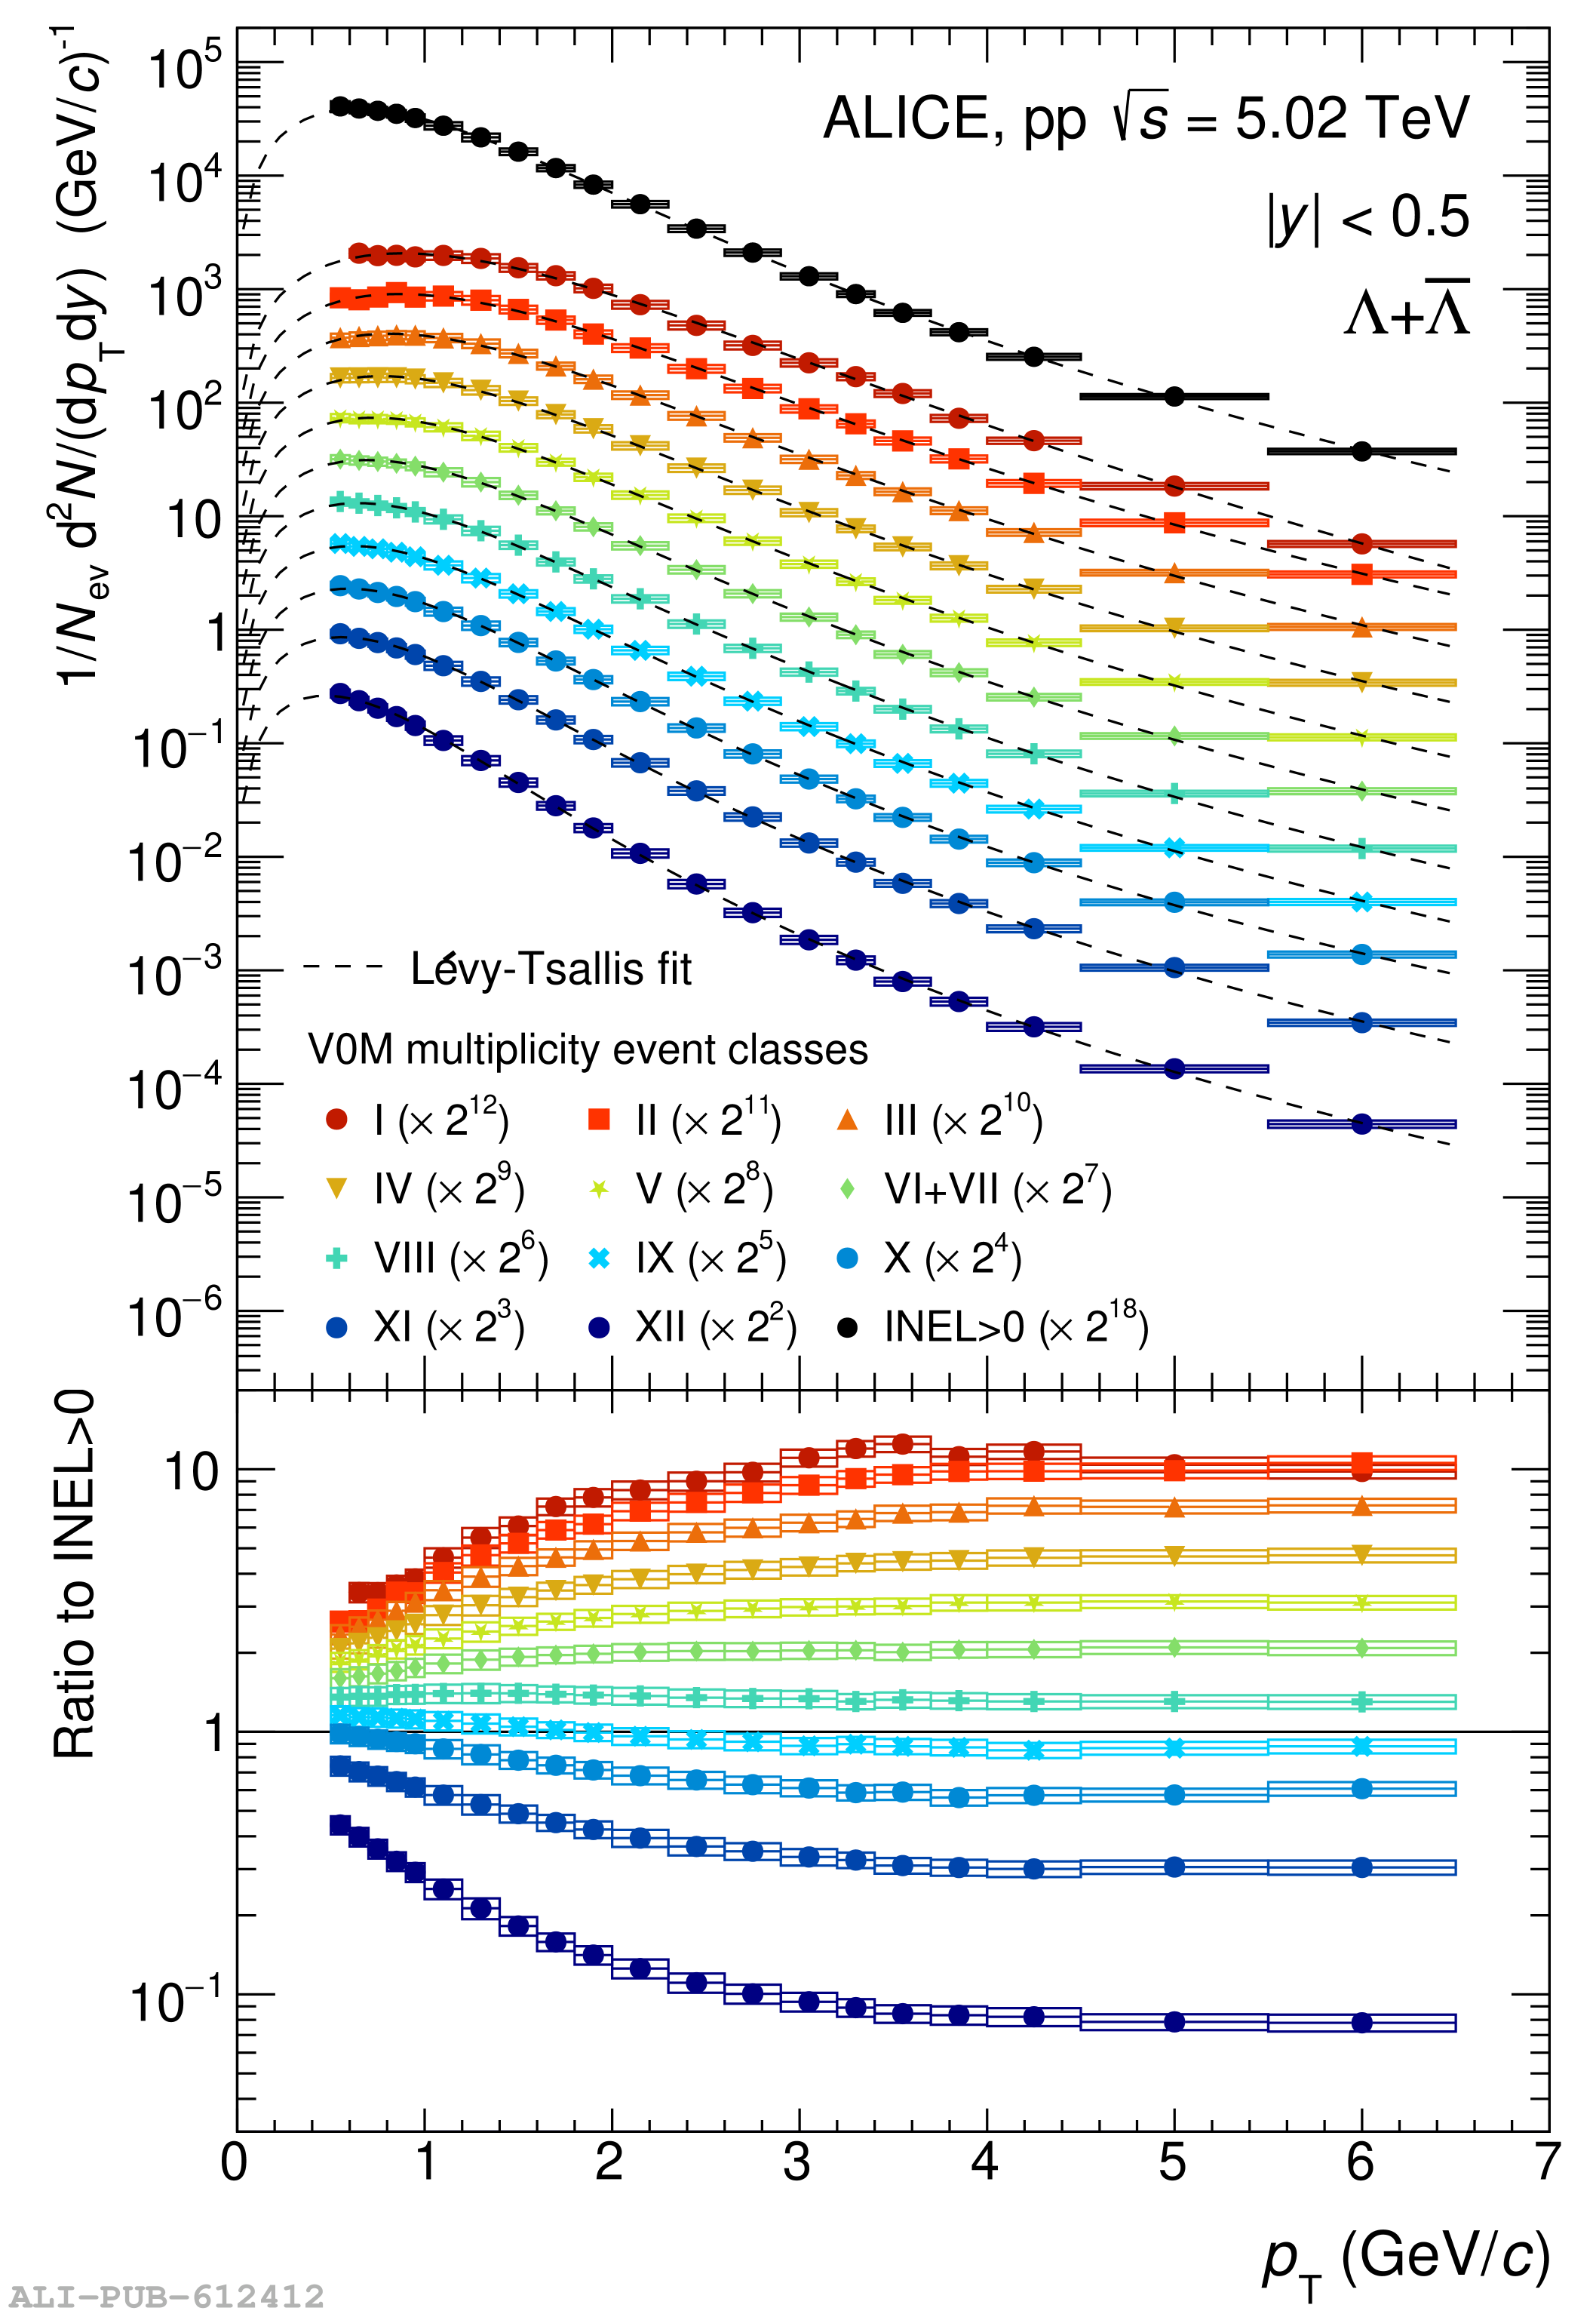 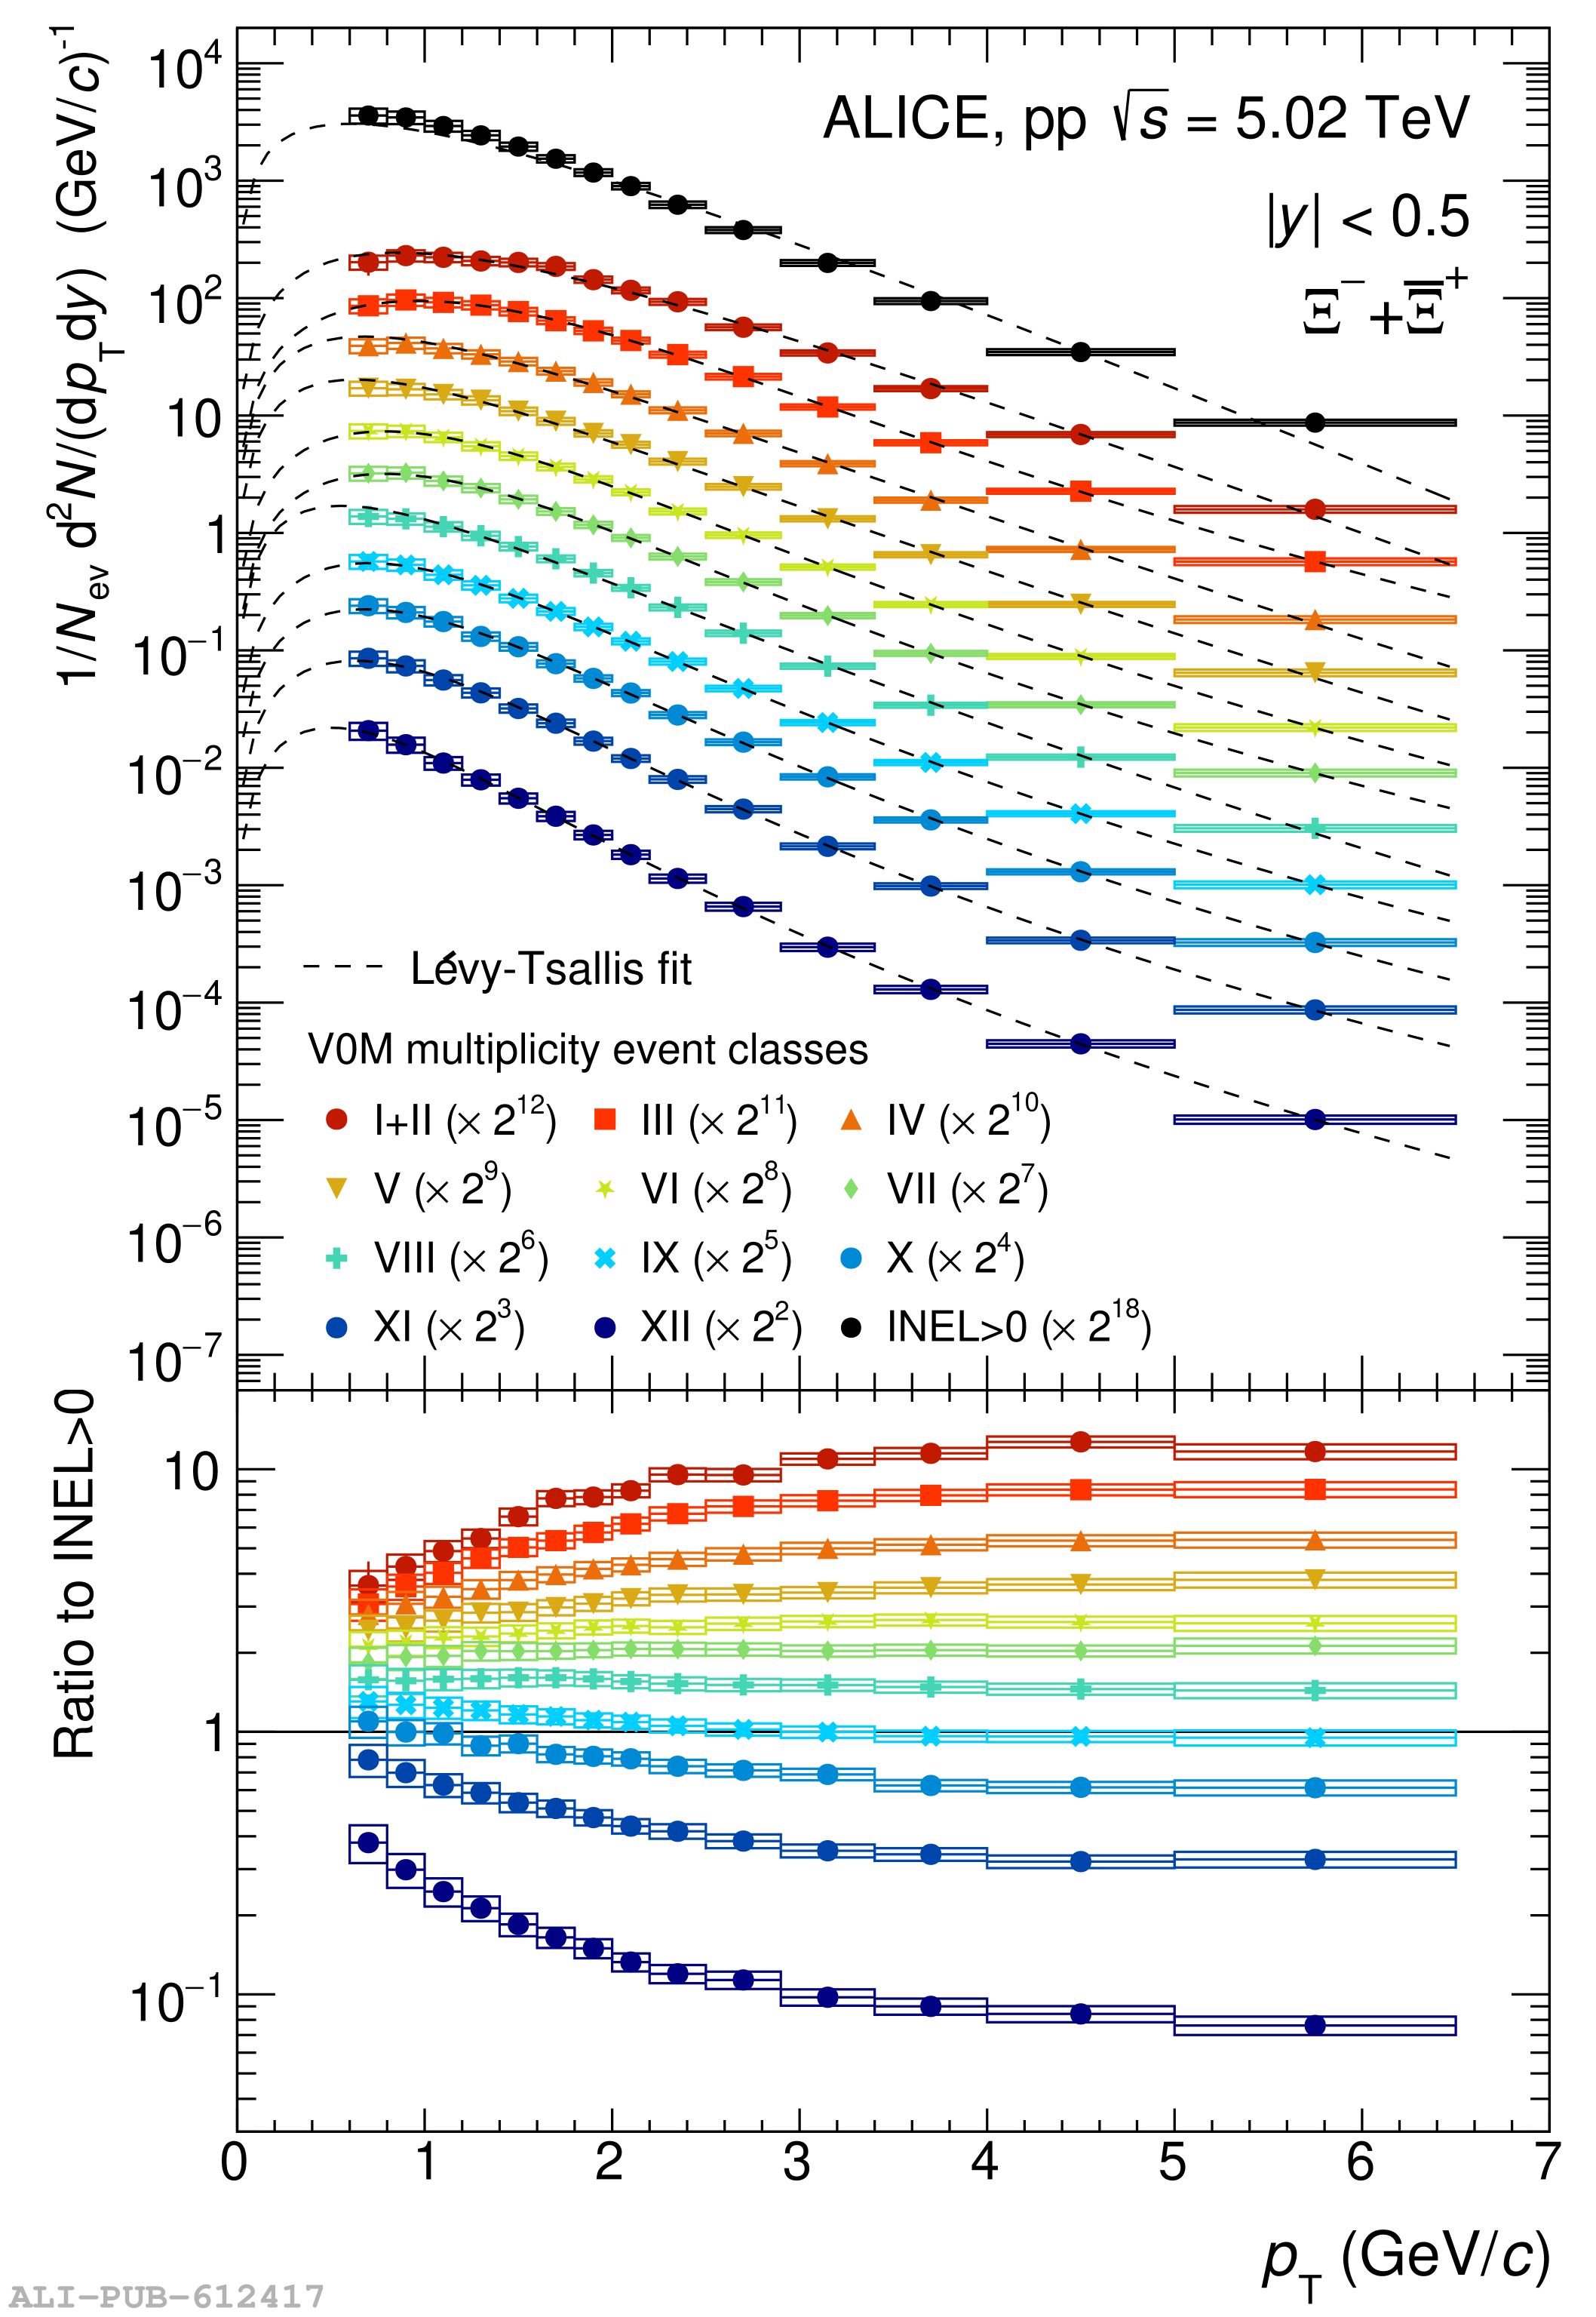 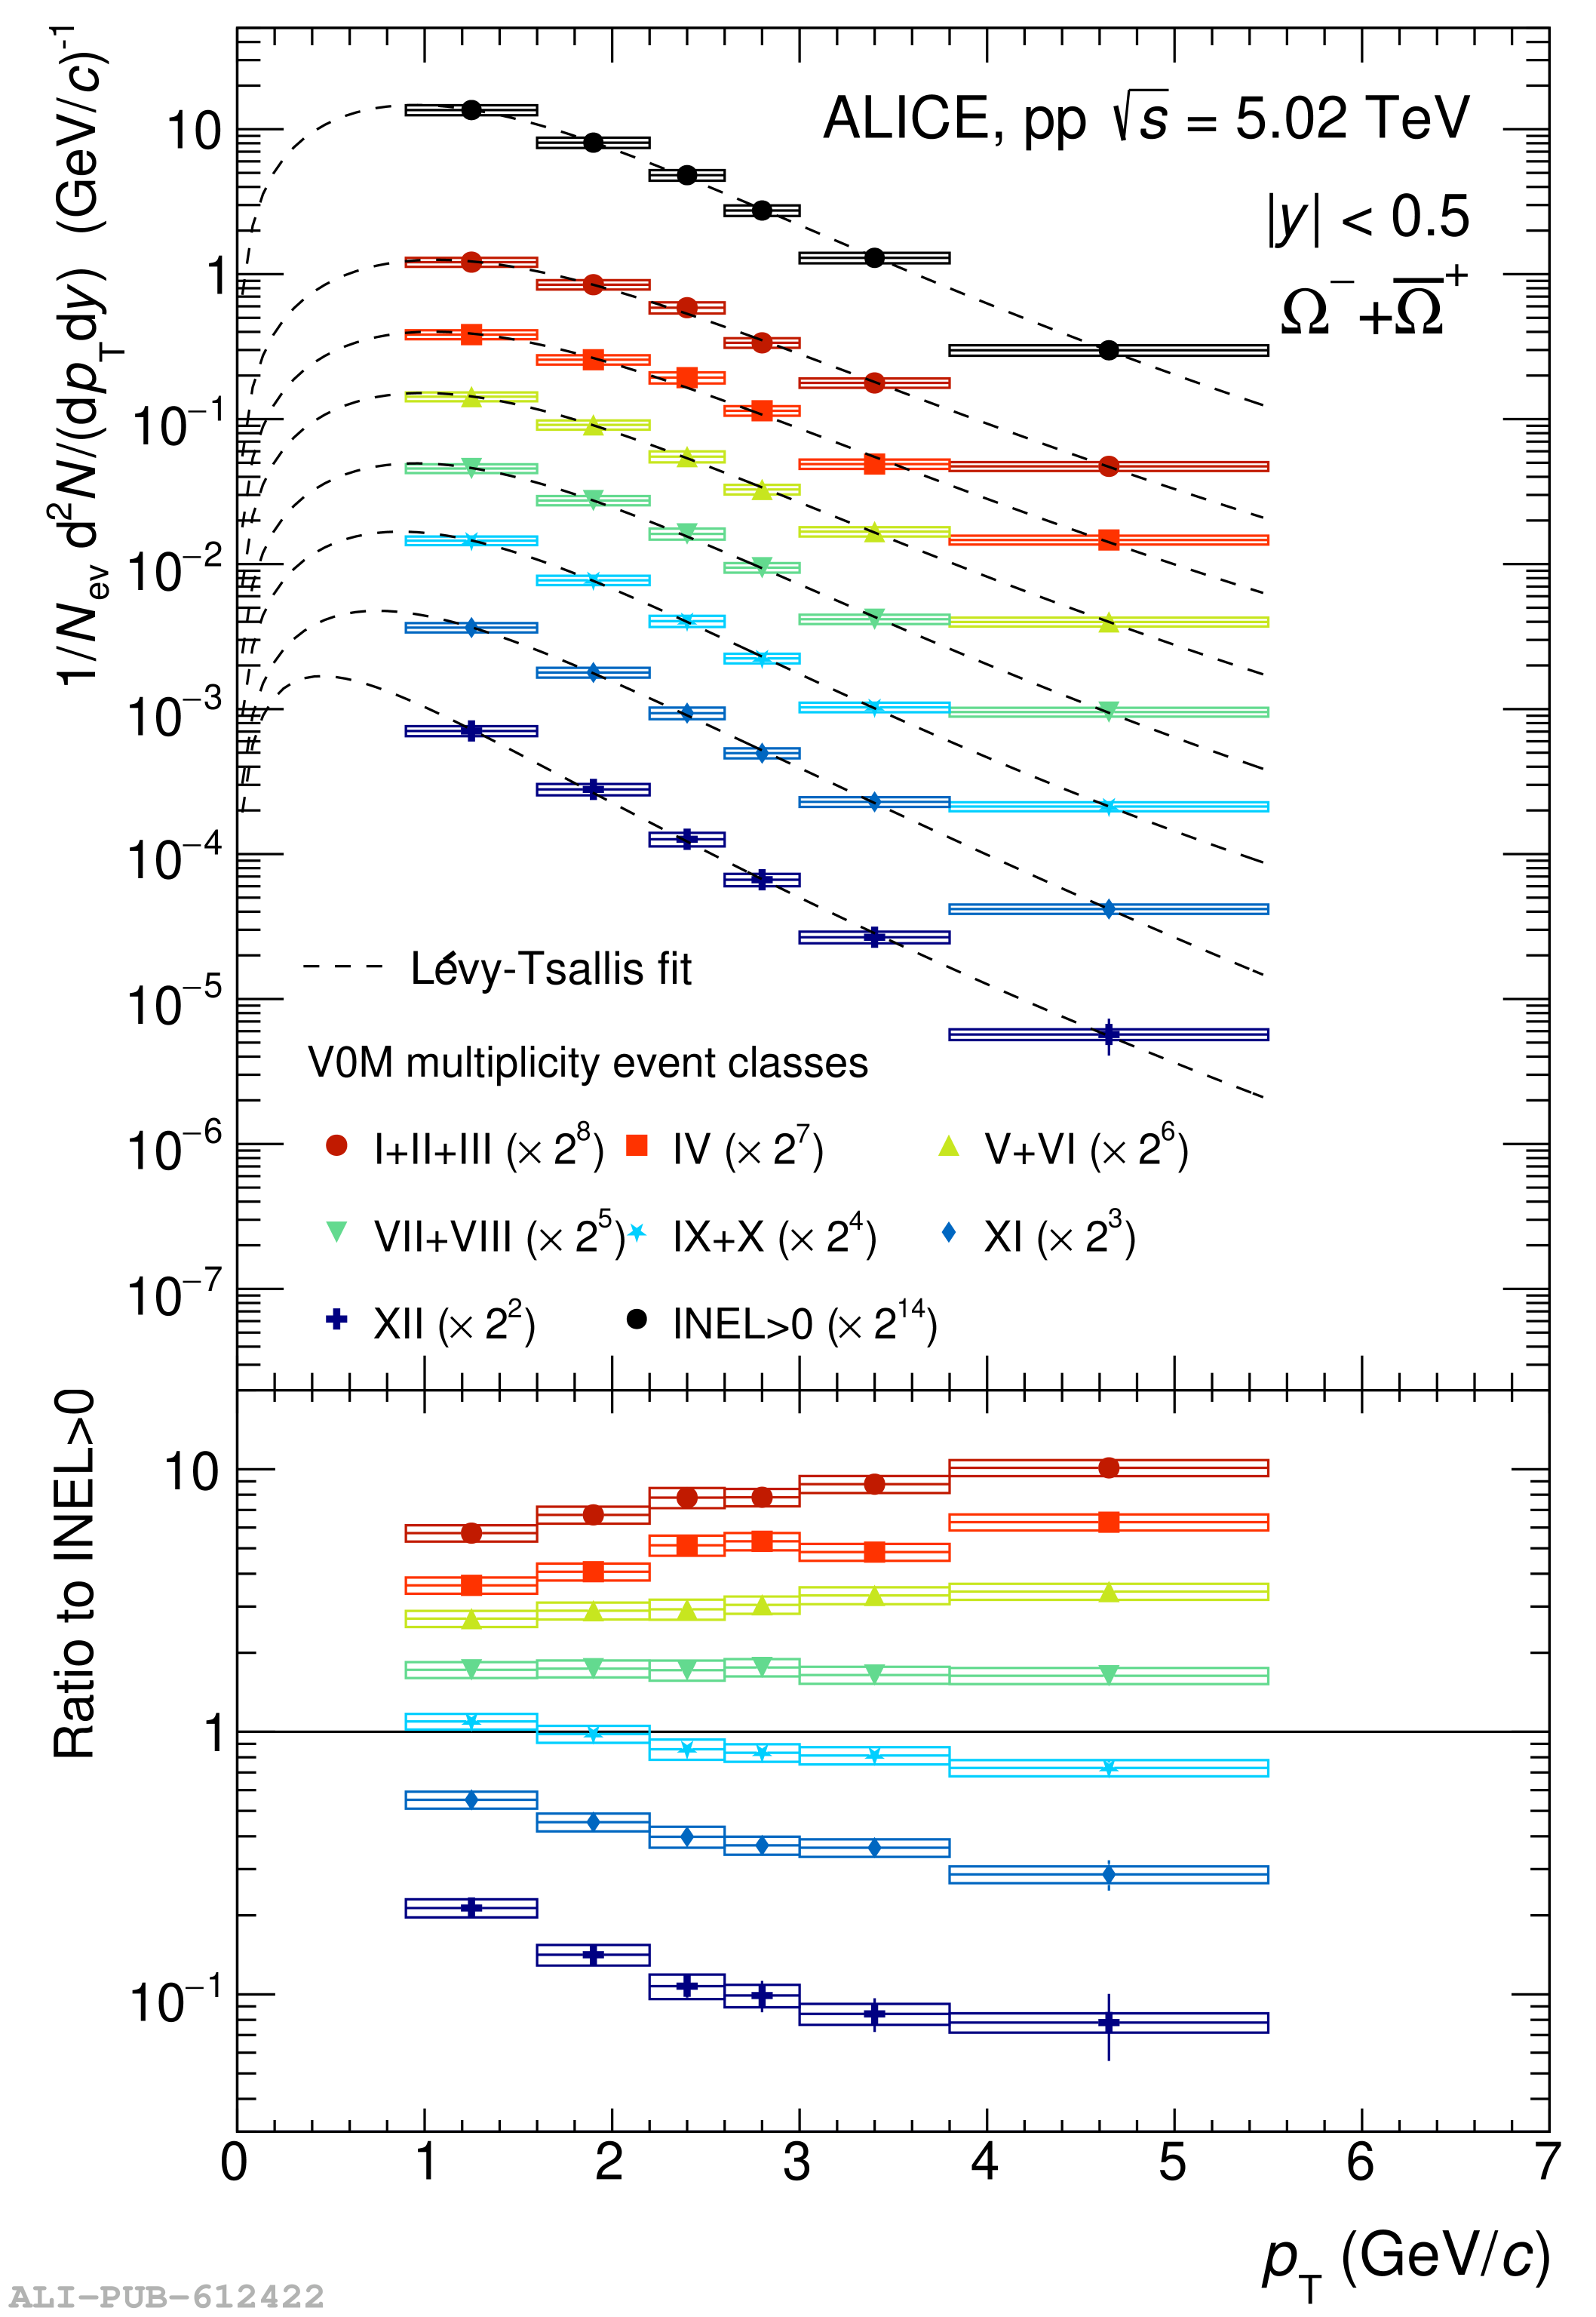 |
Figure 2
\avpt in pp collisions at different center-of-mass energies and midrapidity as a function of the event multiplicity for \kzero and \lmb (top panels), \Xiboth and \Omboth (bottom panels). \five results are shown as black dots, \seven results as green squares and \thirteen results as red diamonds. Statistical uncertainties are reported as error bars, systematic uncertainties as boxes whose width represent the systematic error on the multiplicity determination. | 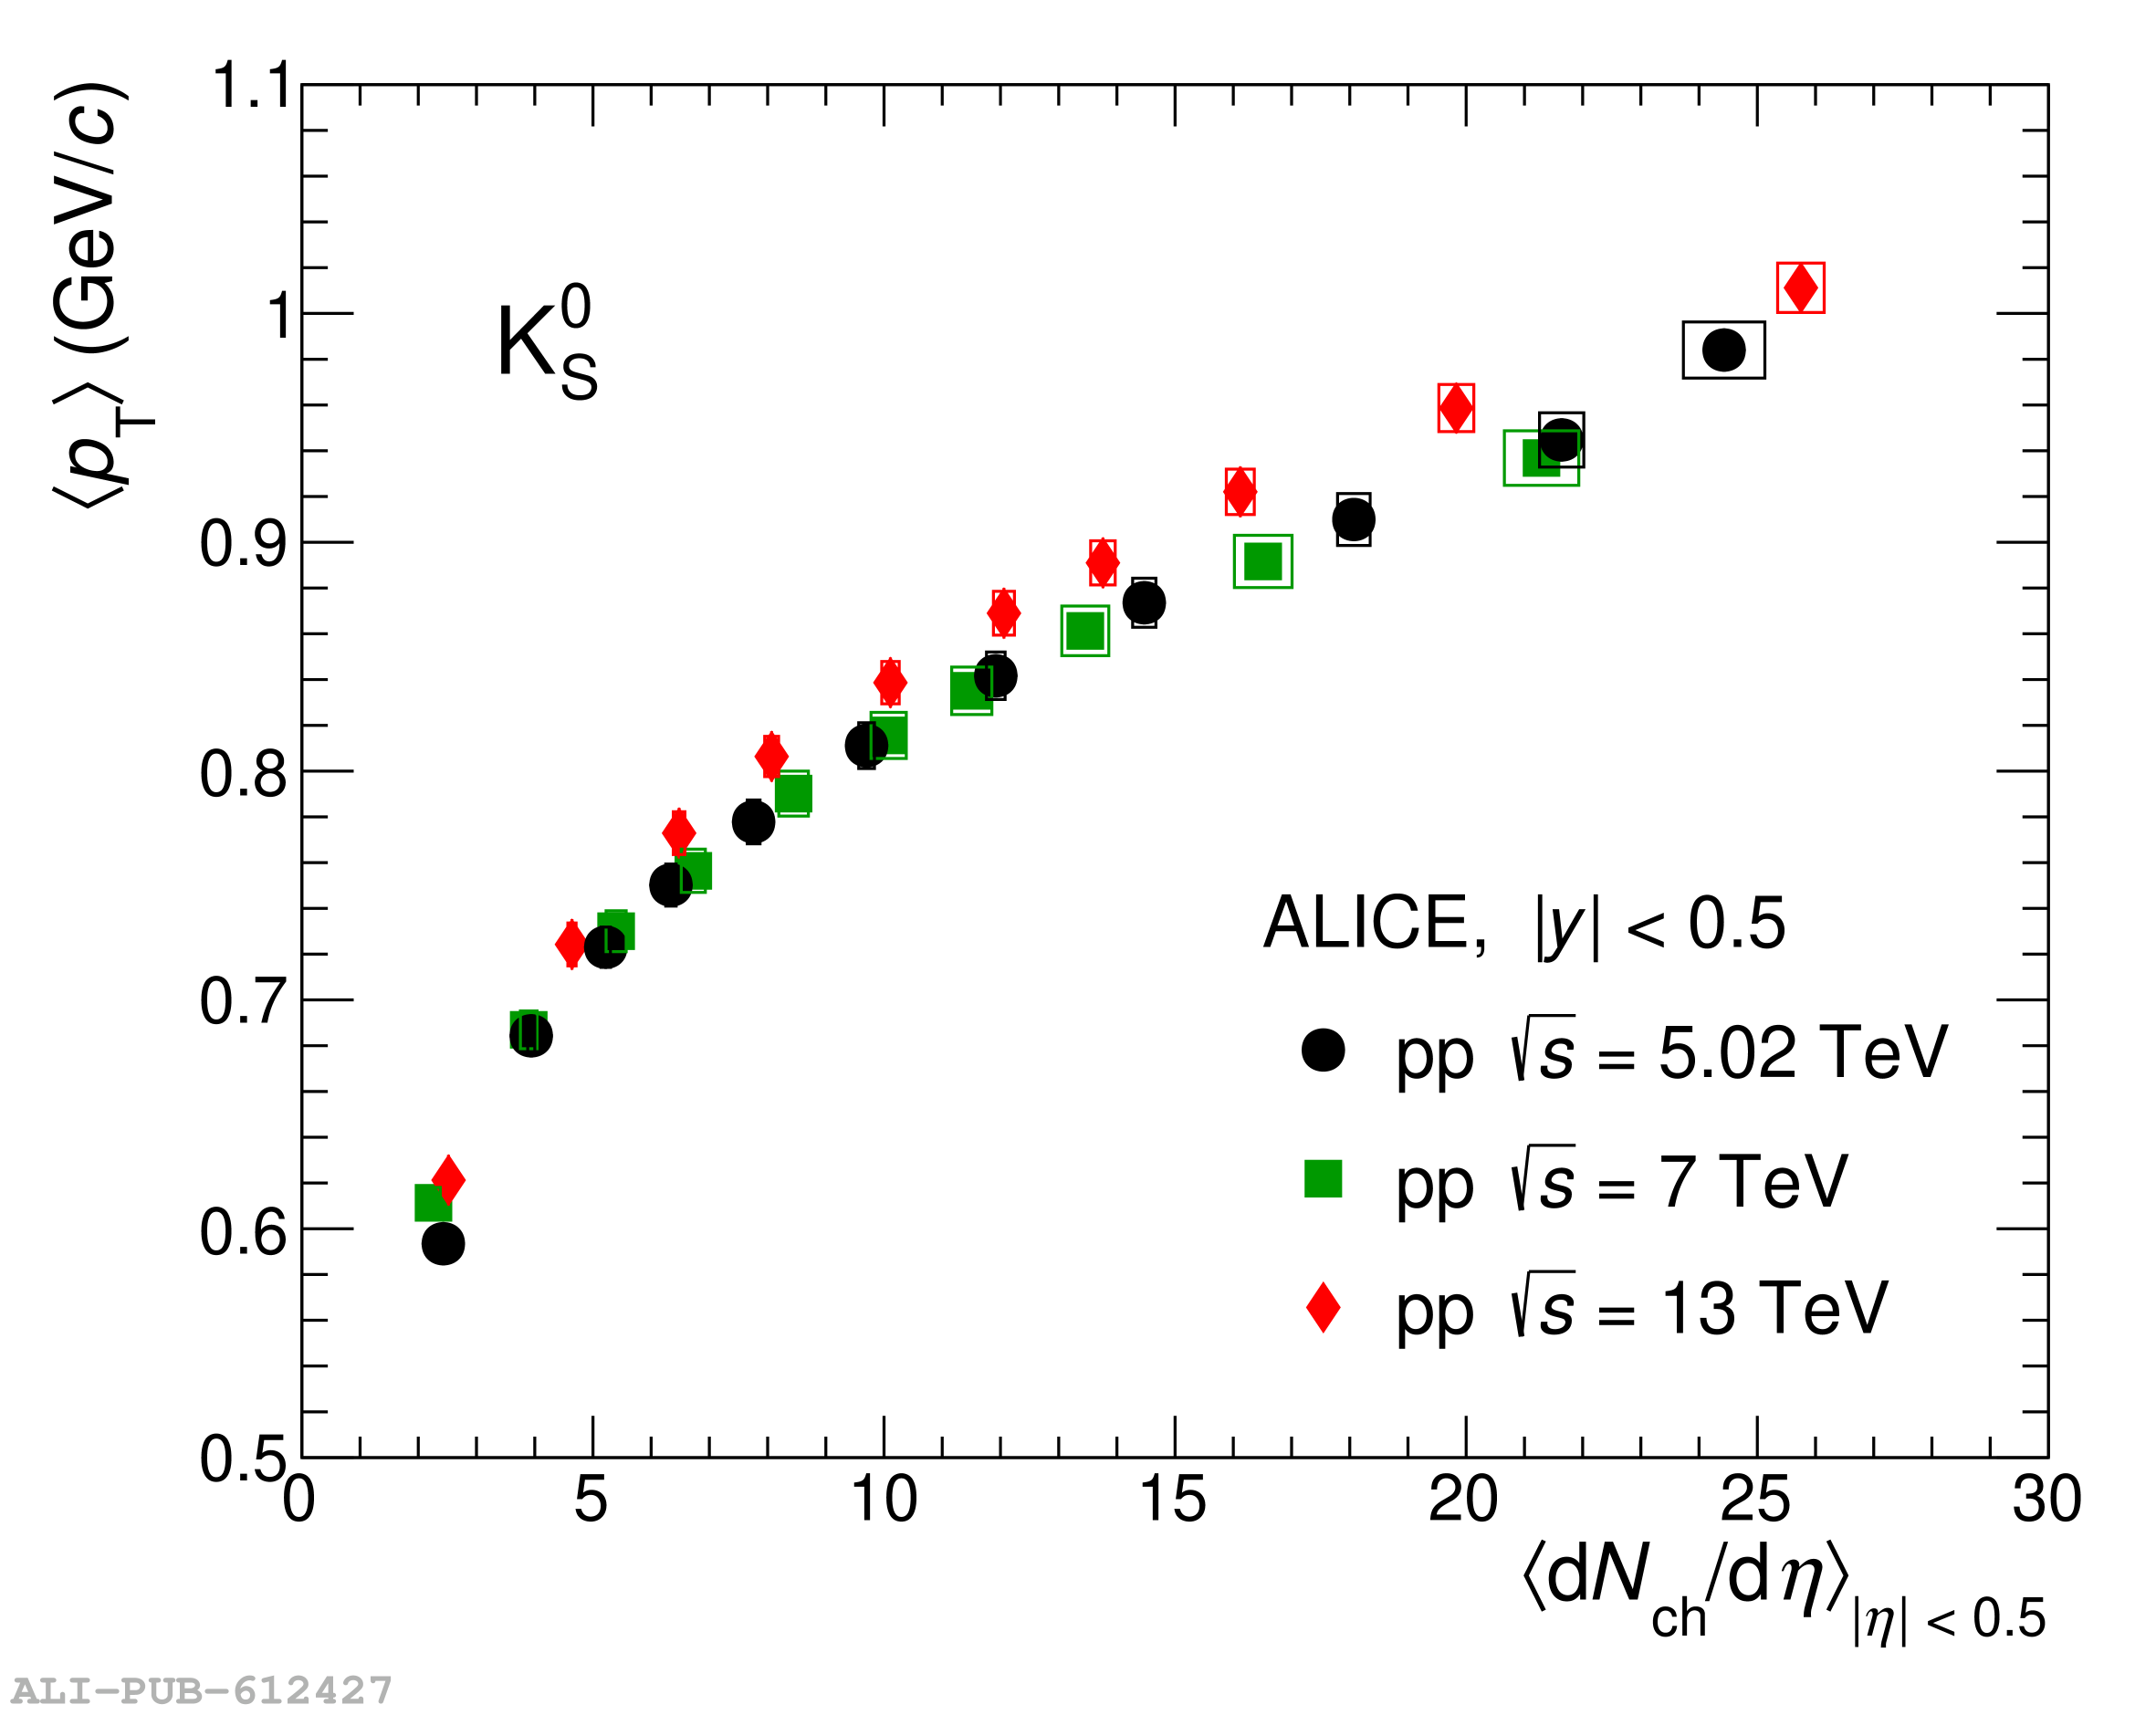 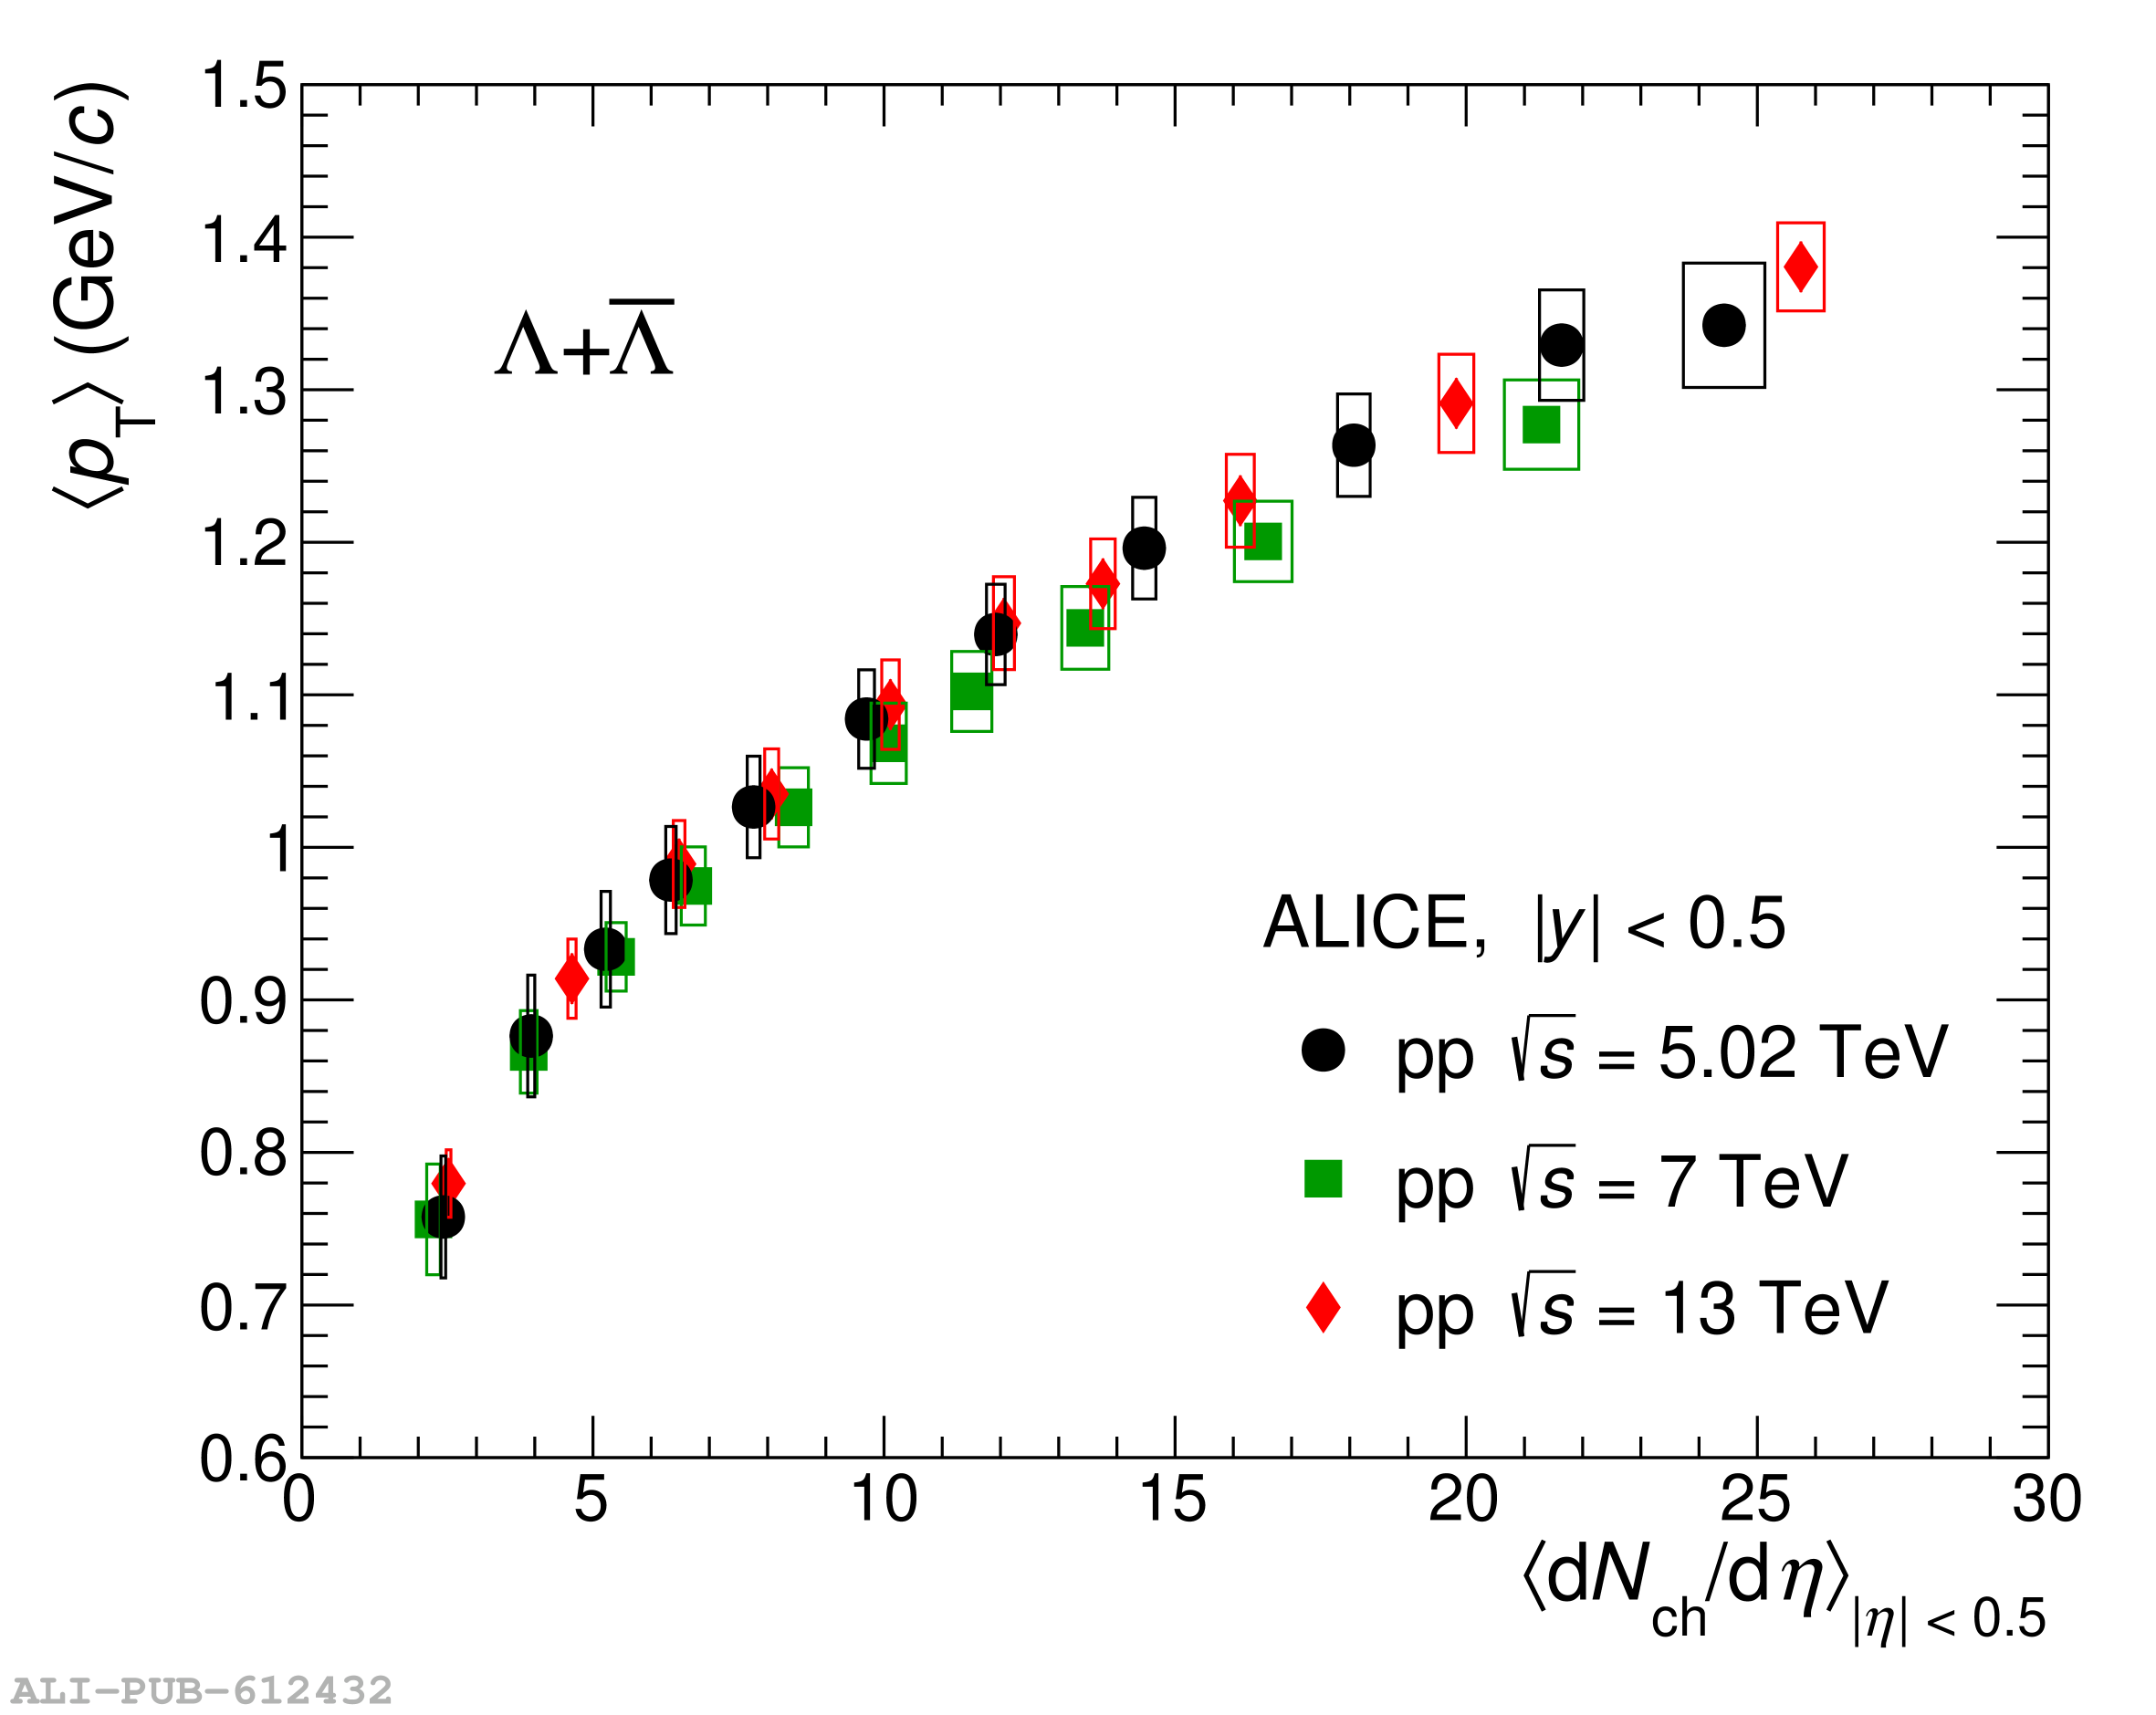 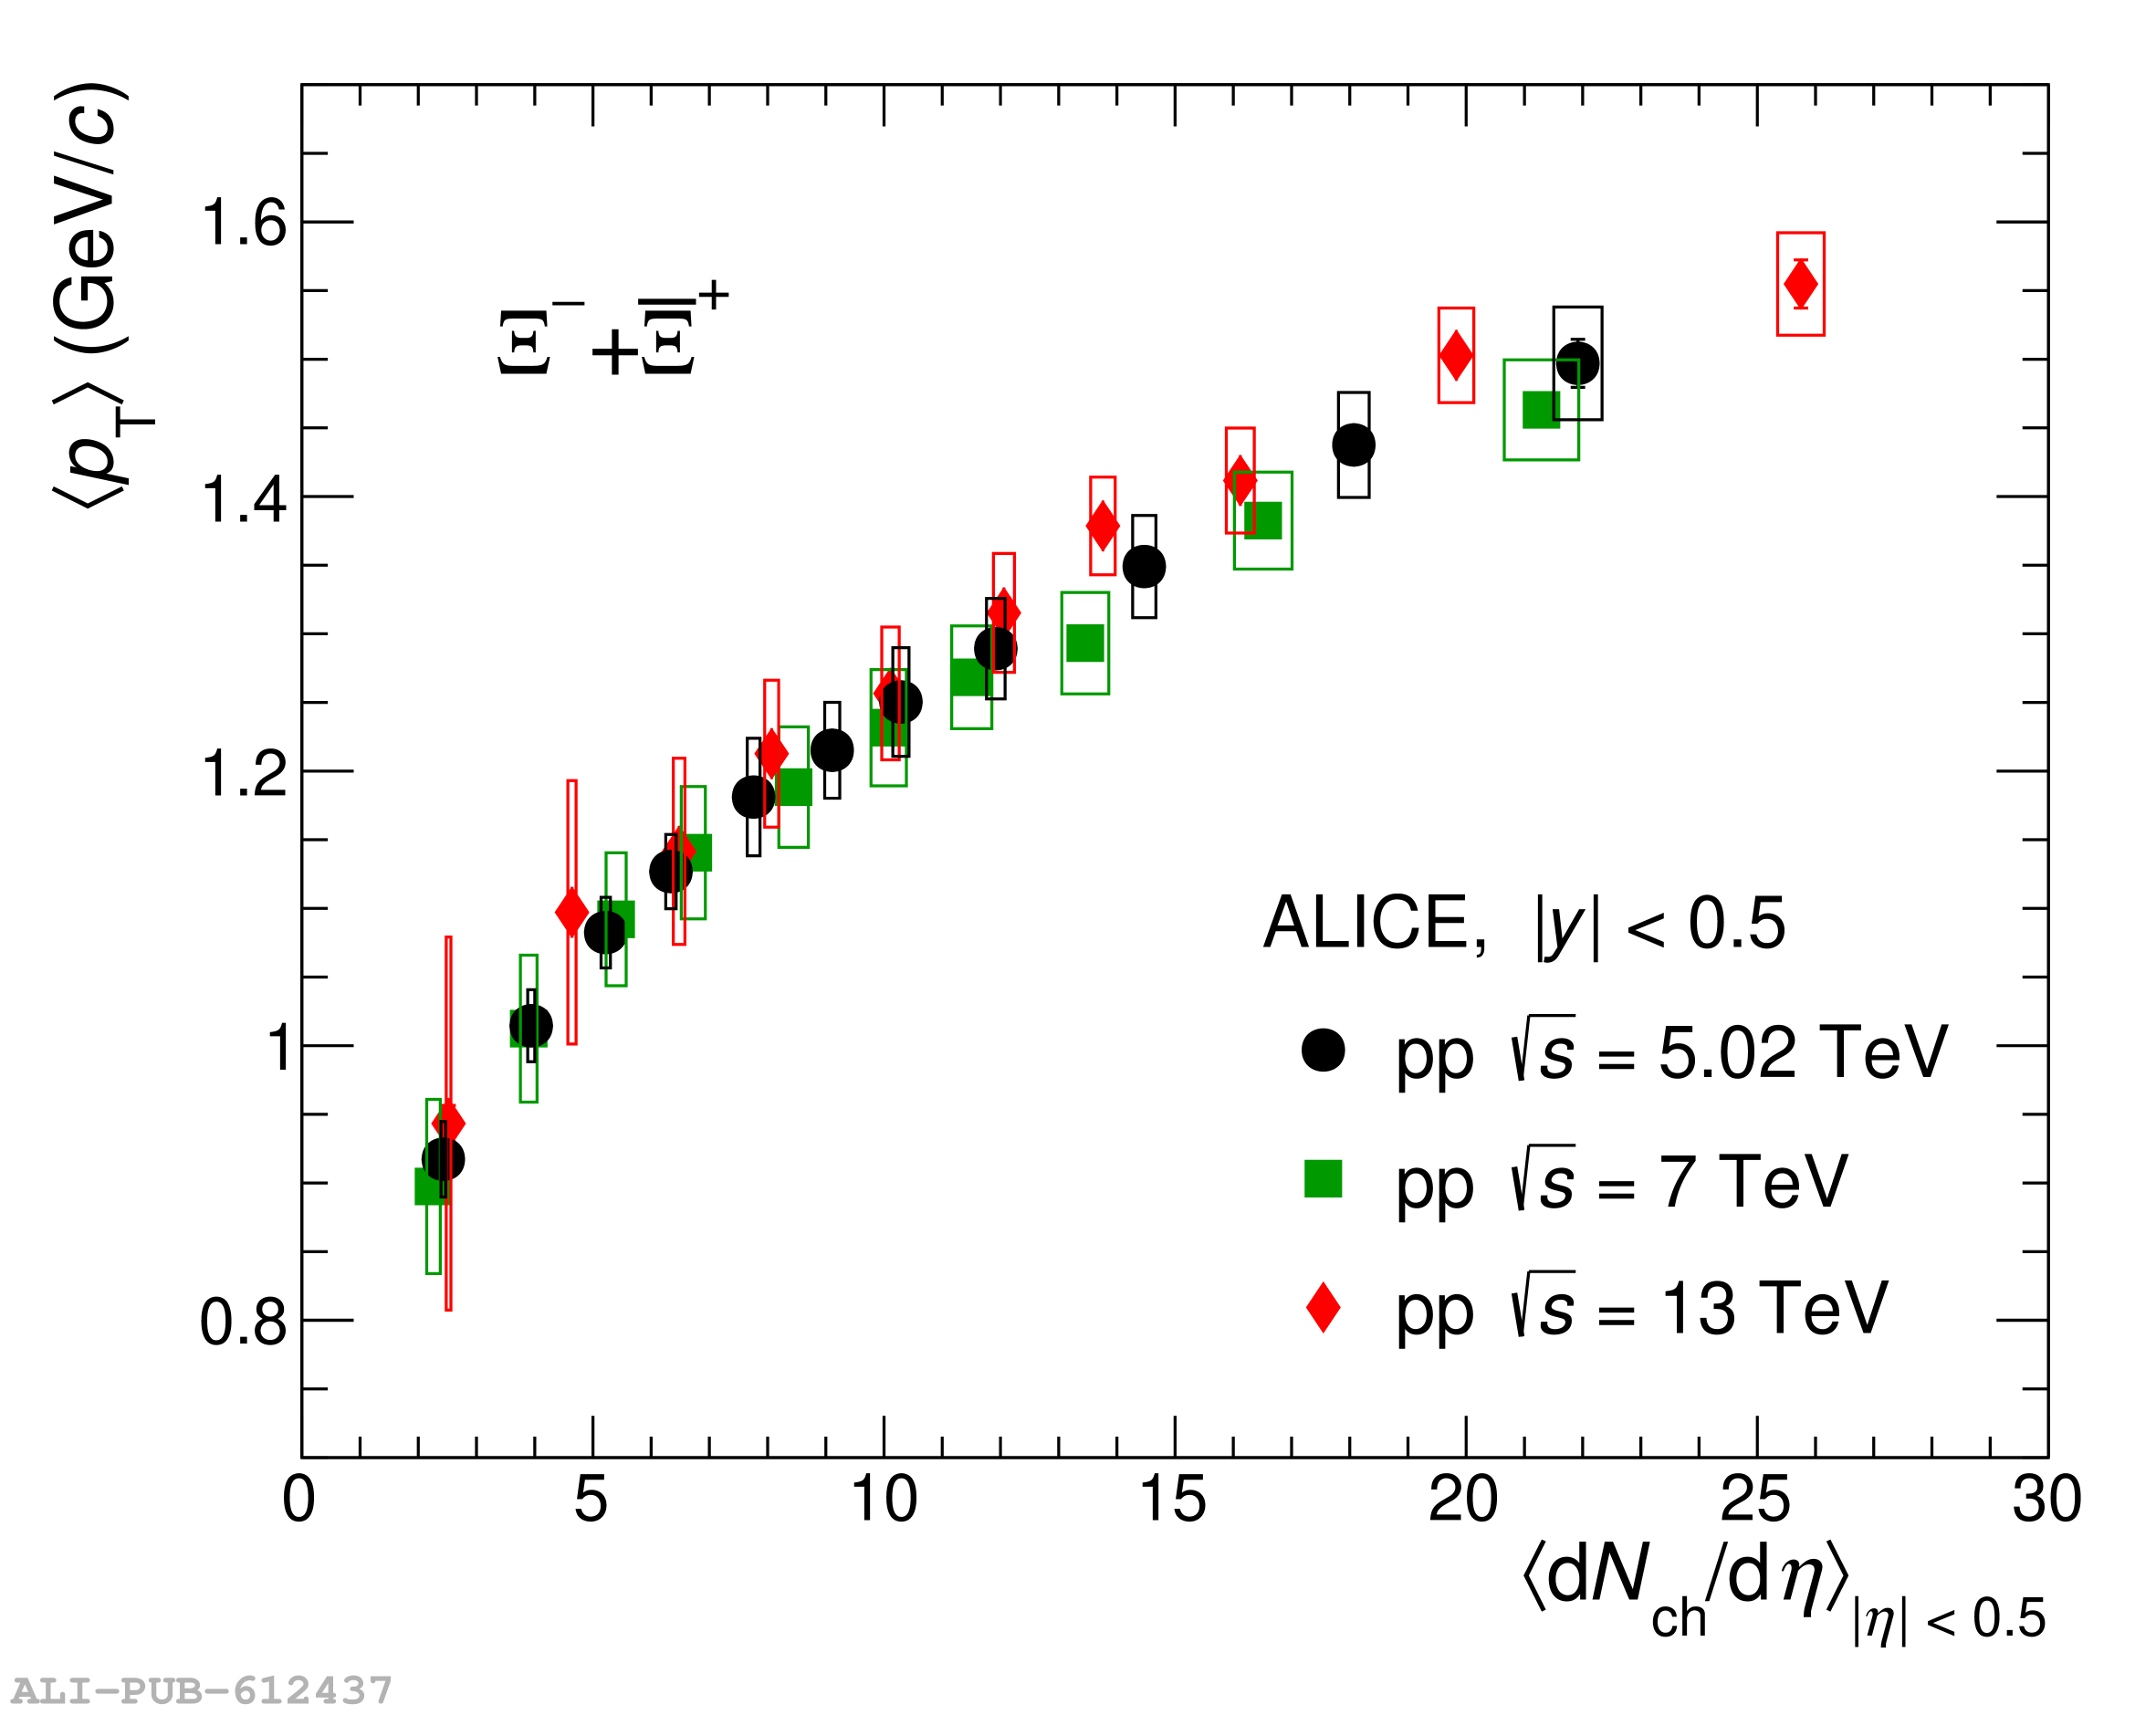 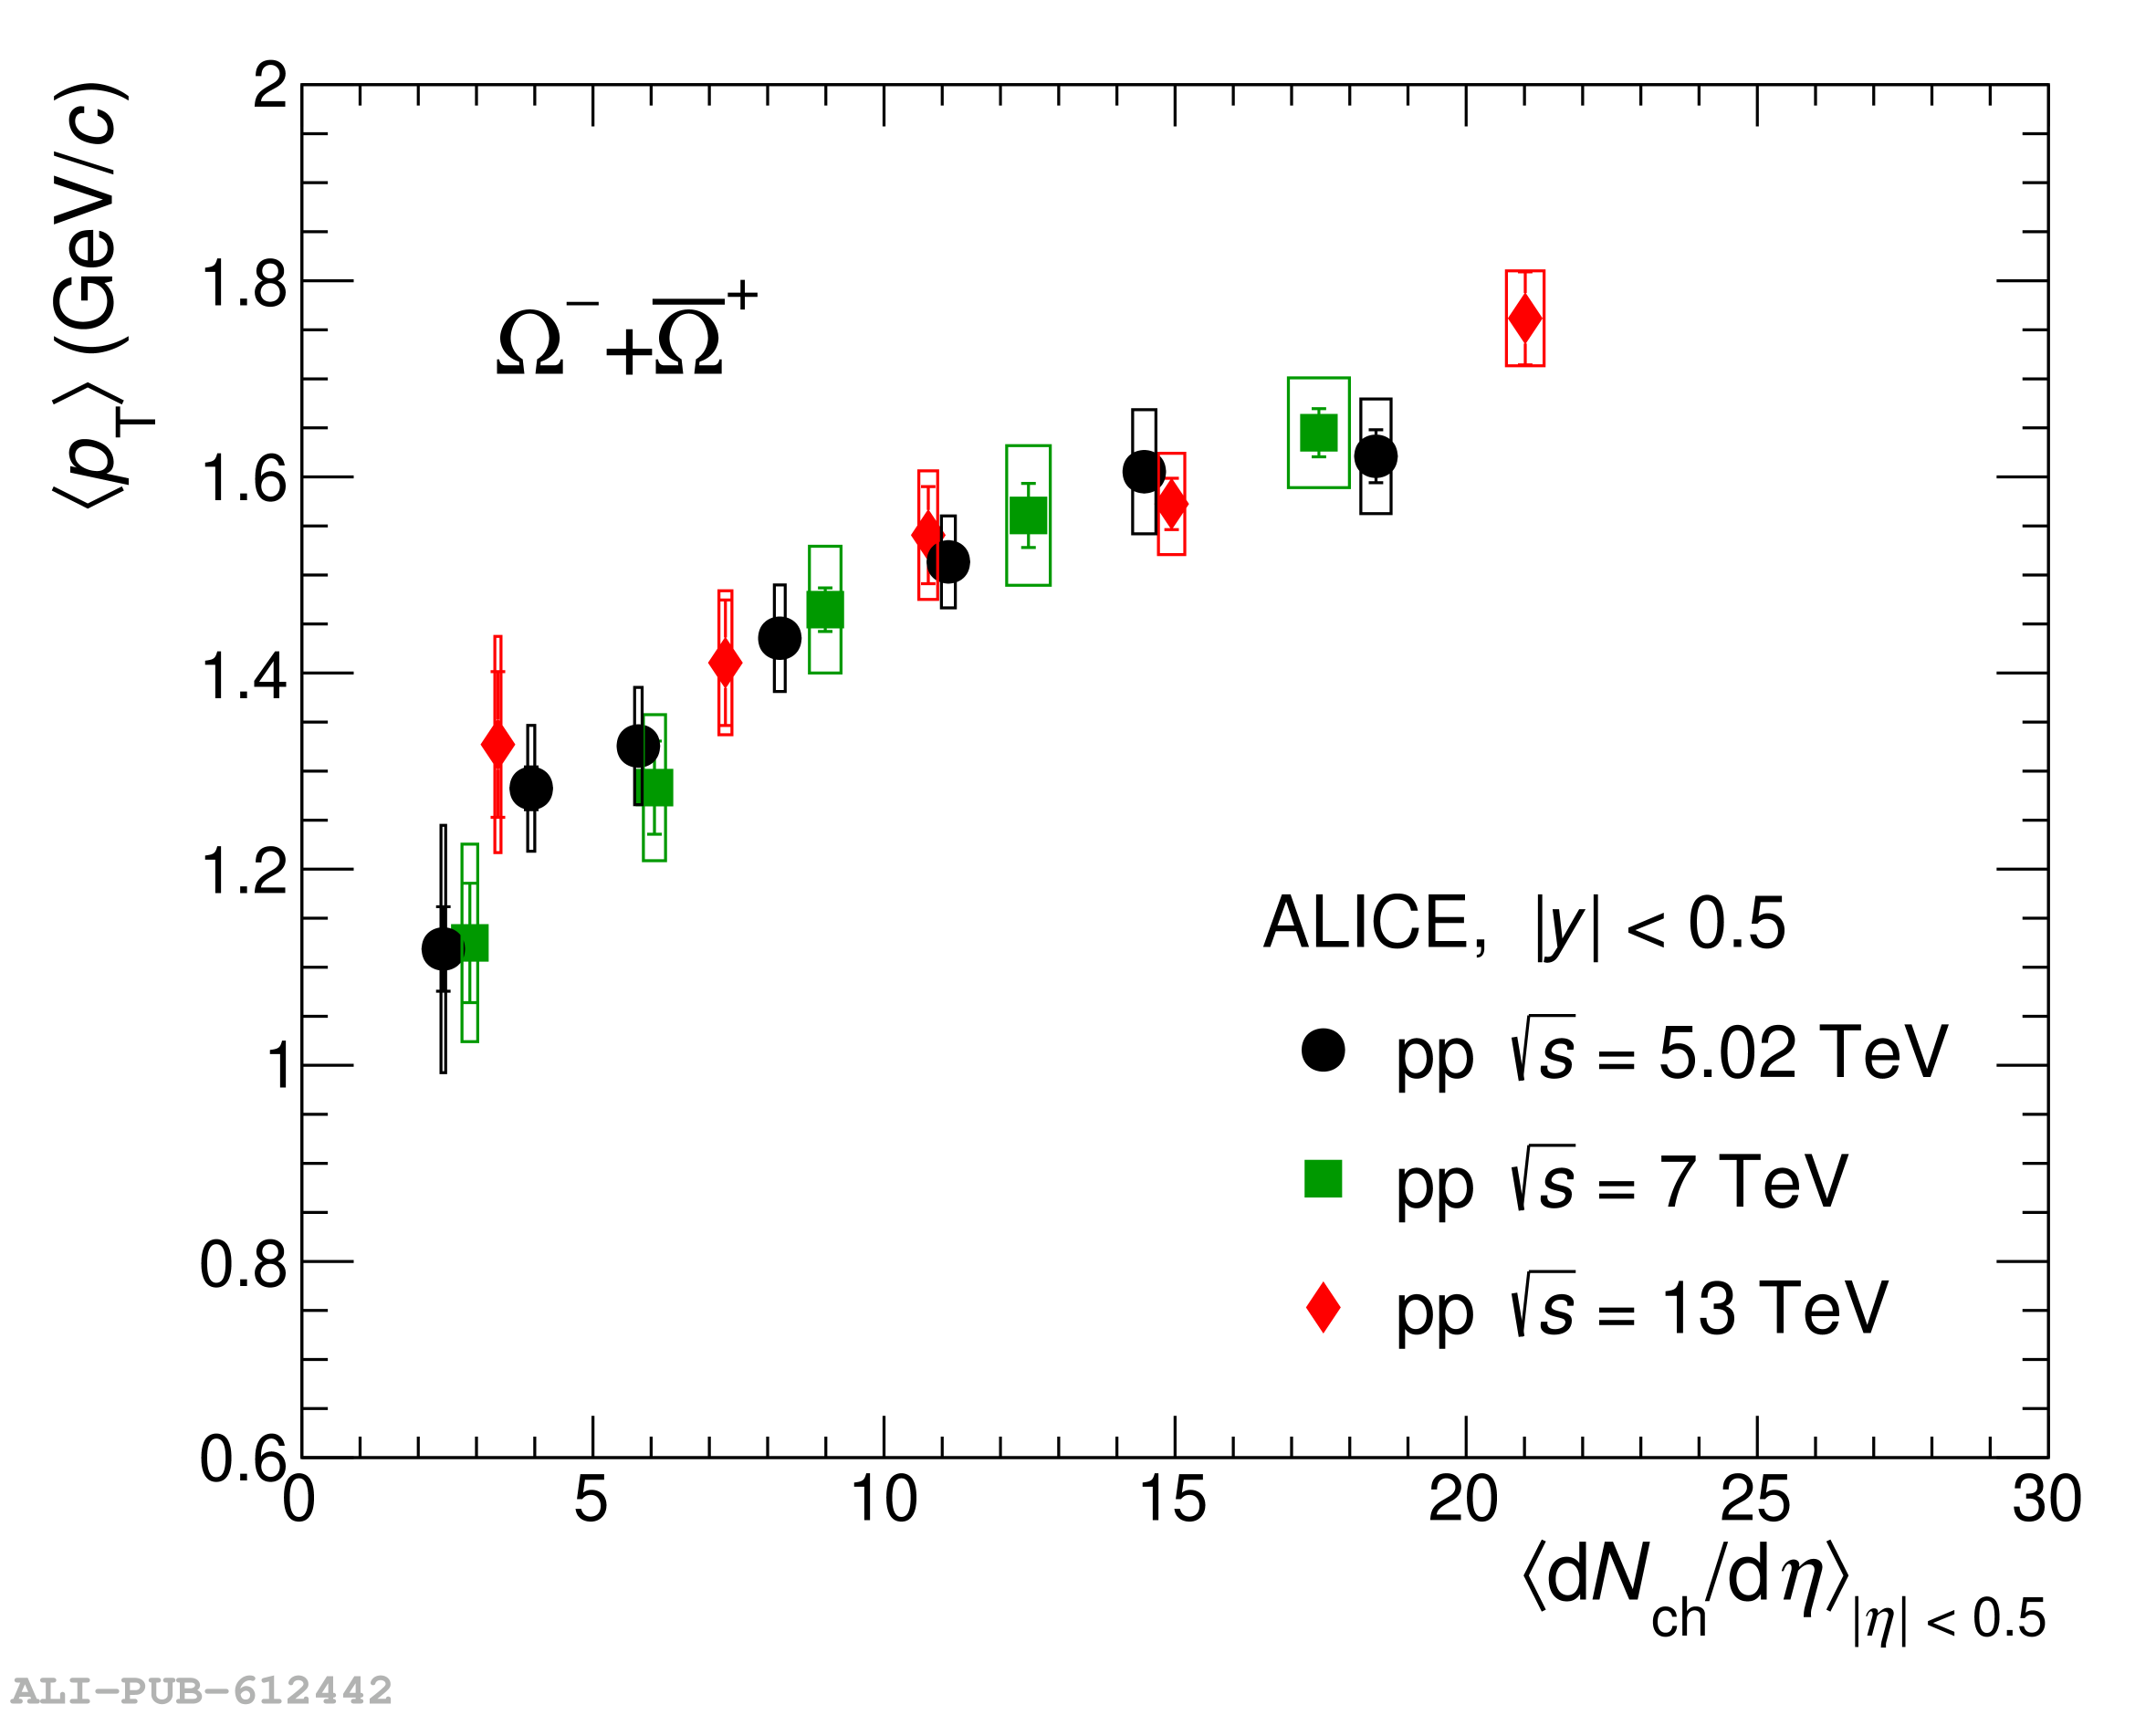 |
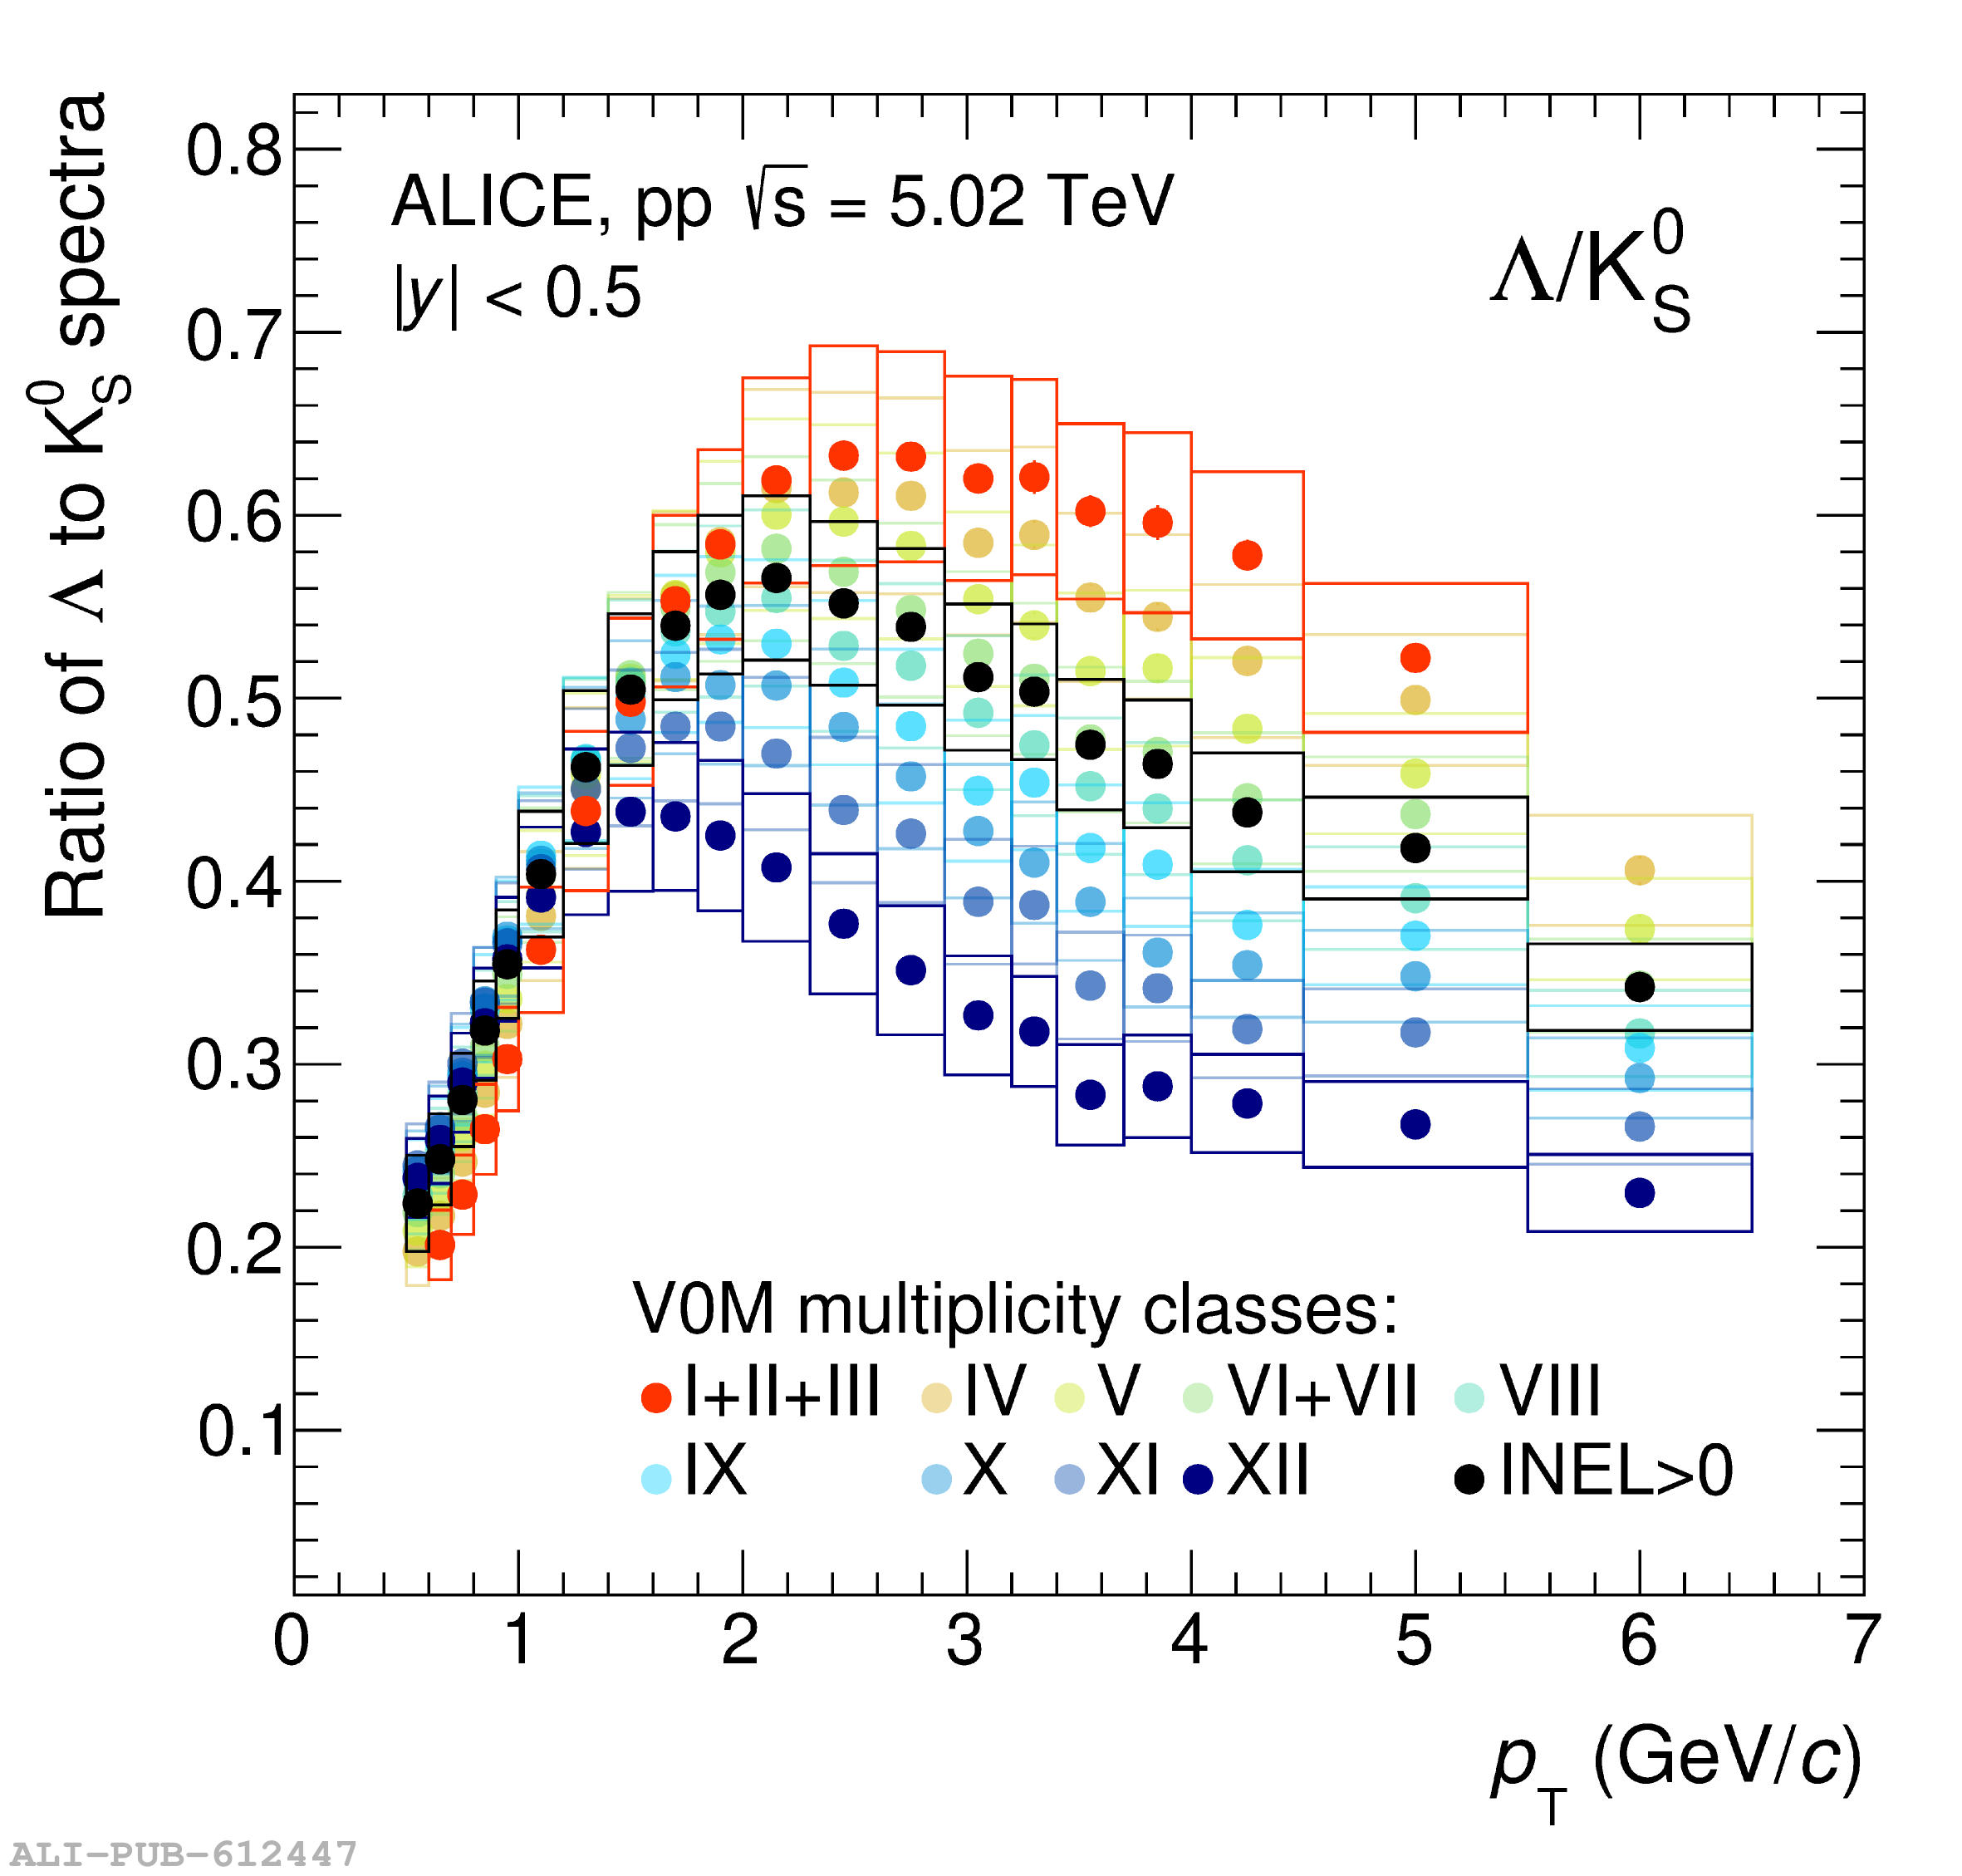
Figure 4
\pt-integrated yields in pp collisions at different center-of-mass energies and midrapidity as a function of the event multiplicity for \kzero and \lmb (top panels), \Xiboth and \Omboth (bottom panels). \five results are shown as black dots, \seven results as green squares and \thirteen results as red diamonds. Statistical uncertainties are represented as error bars and systematic uncertainties as boxes whose width represent the systematic error on the multiplicity determination. Linear combined fits are shown as dashed lines, while the quadratic fit to the \Omboth progression is shown as a dotted line. | 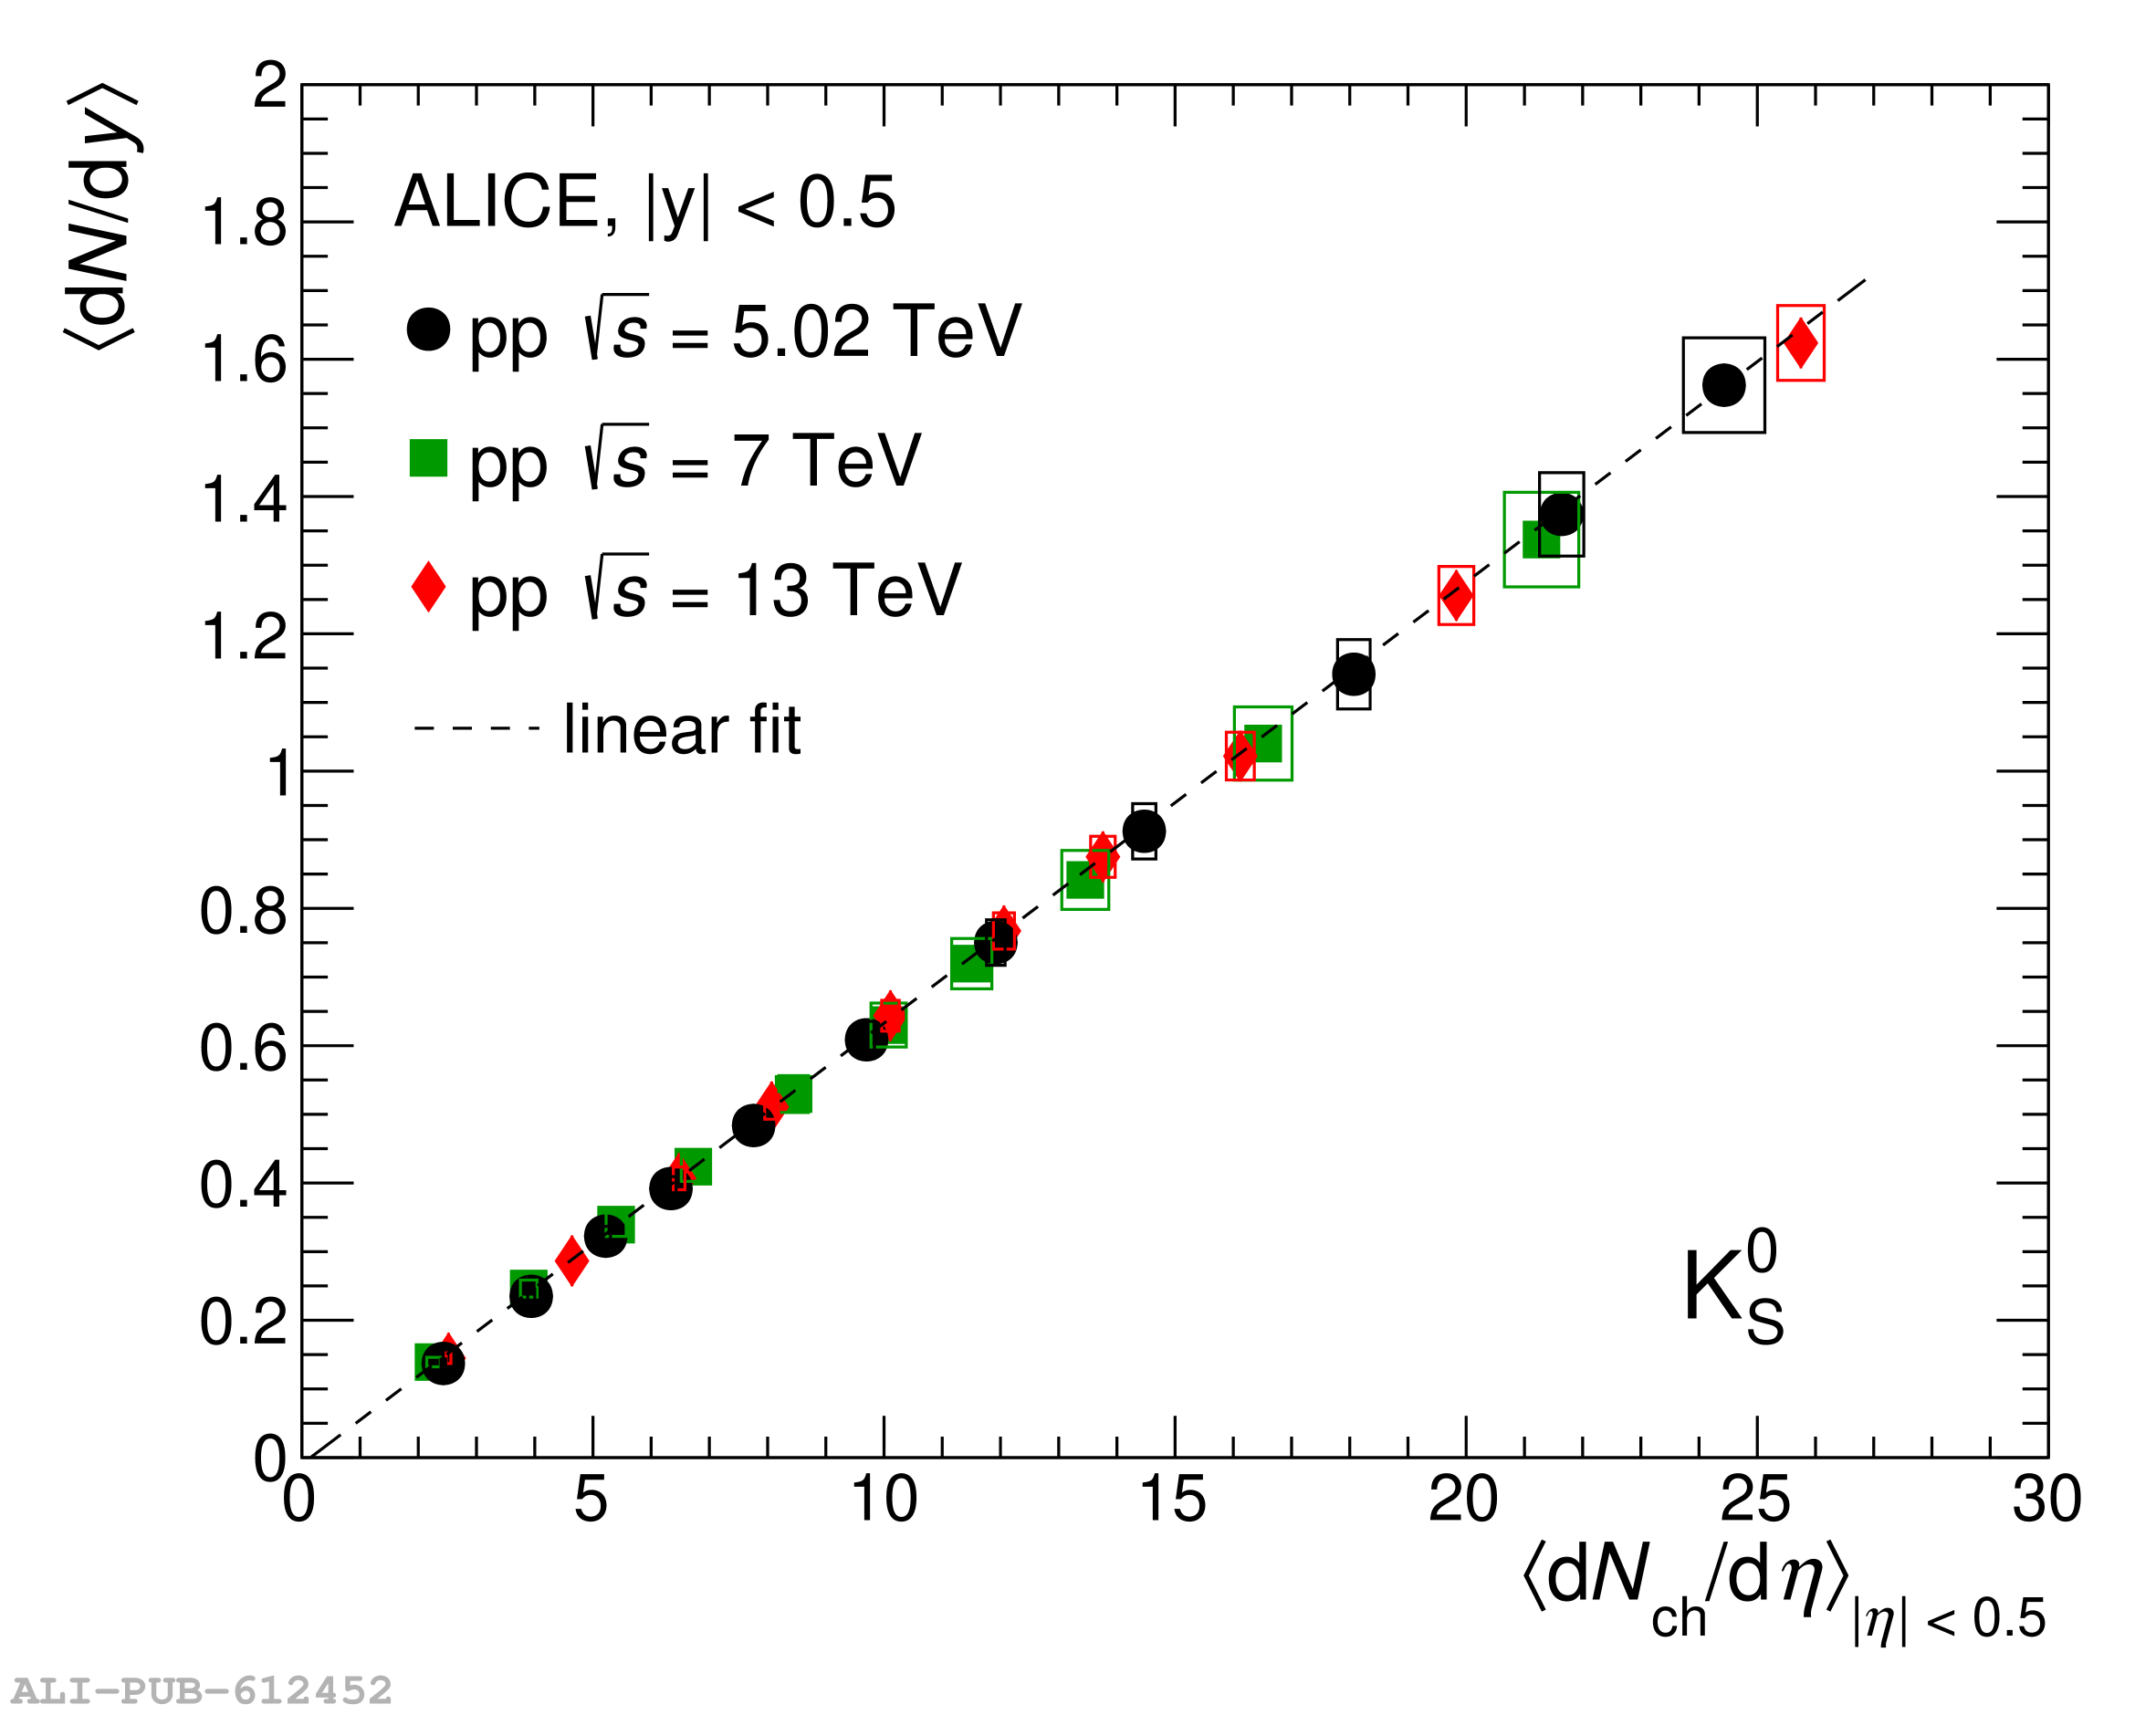 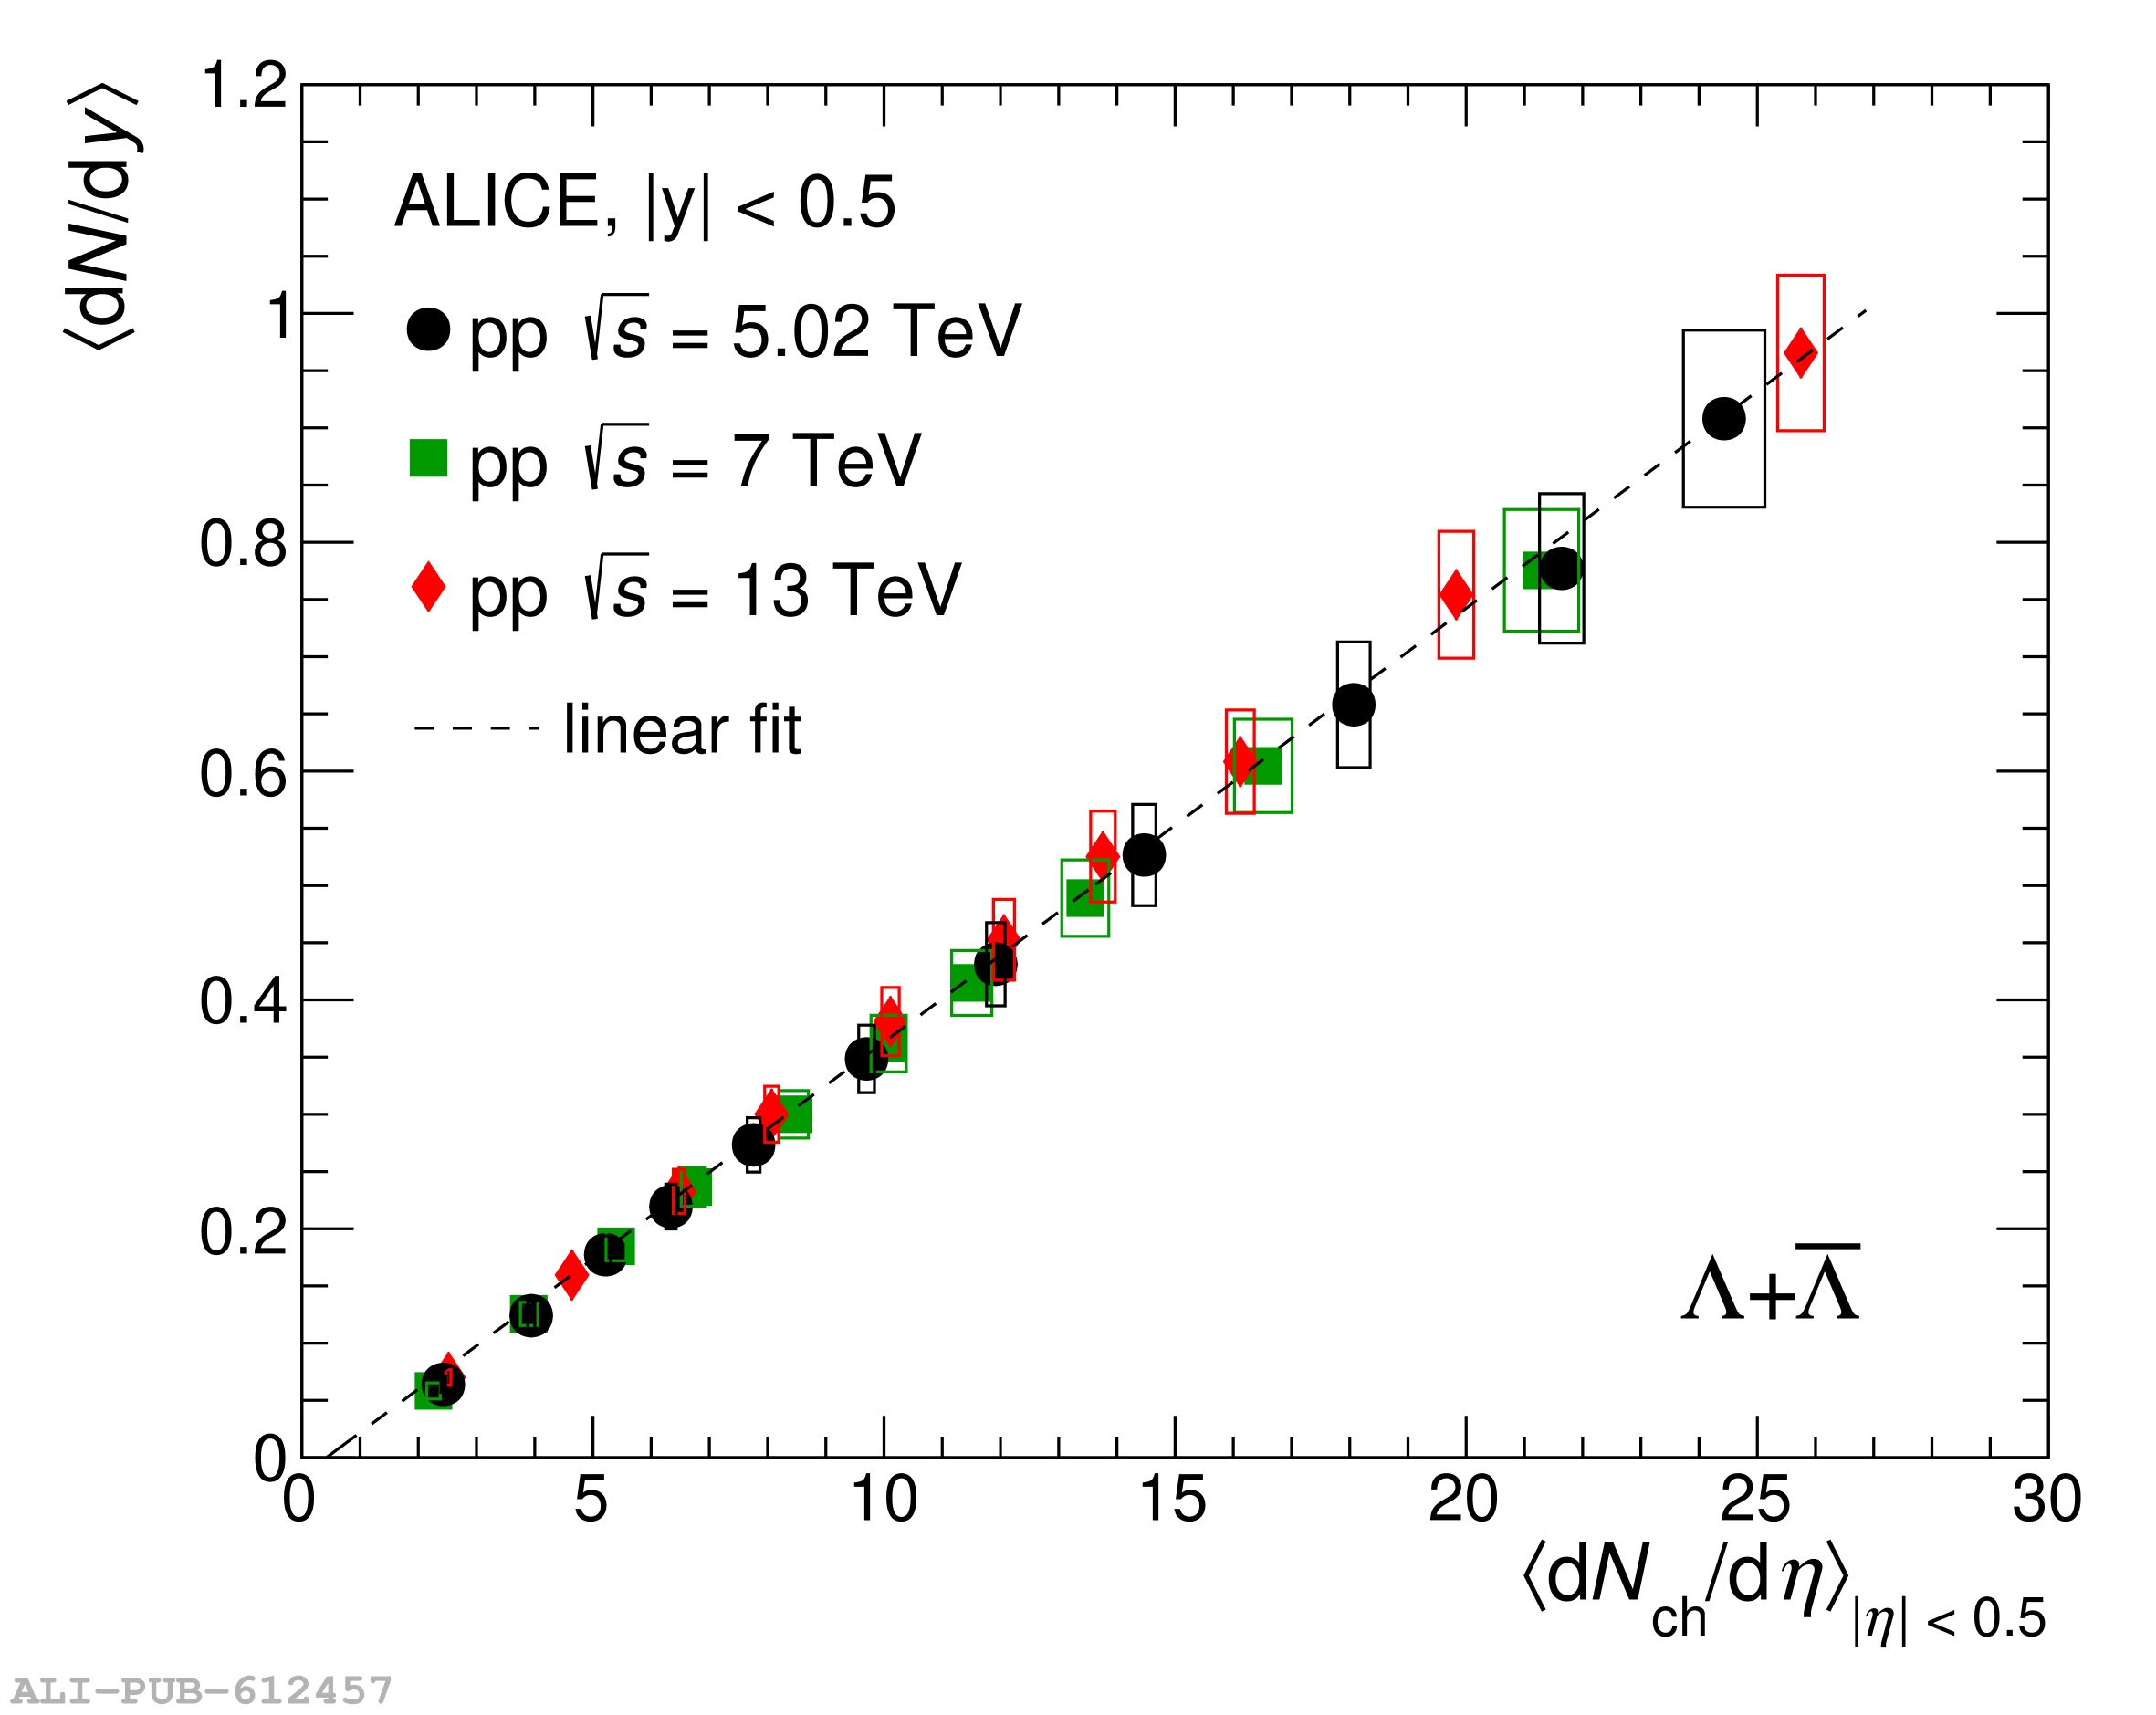 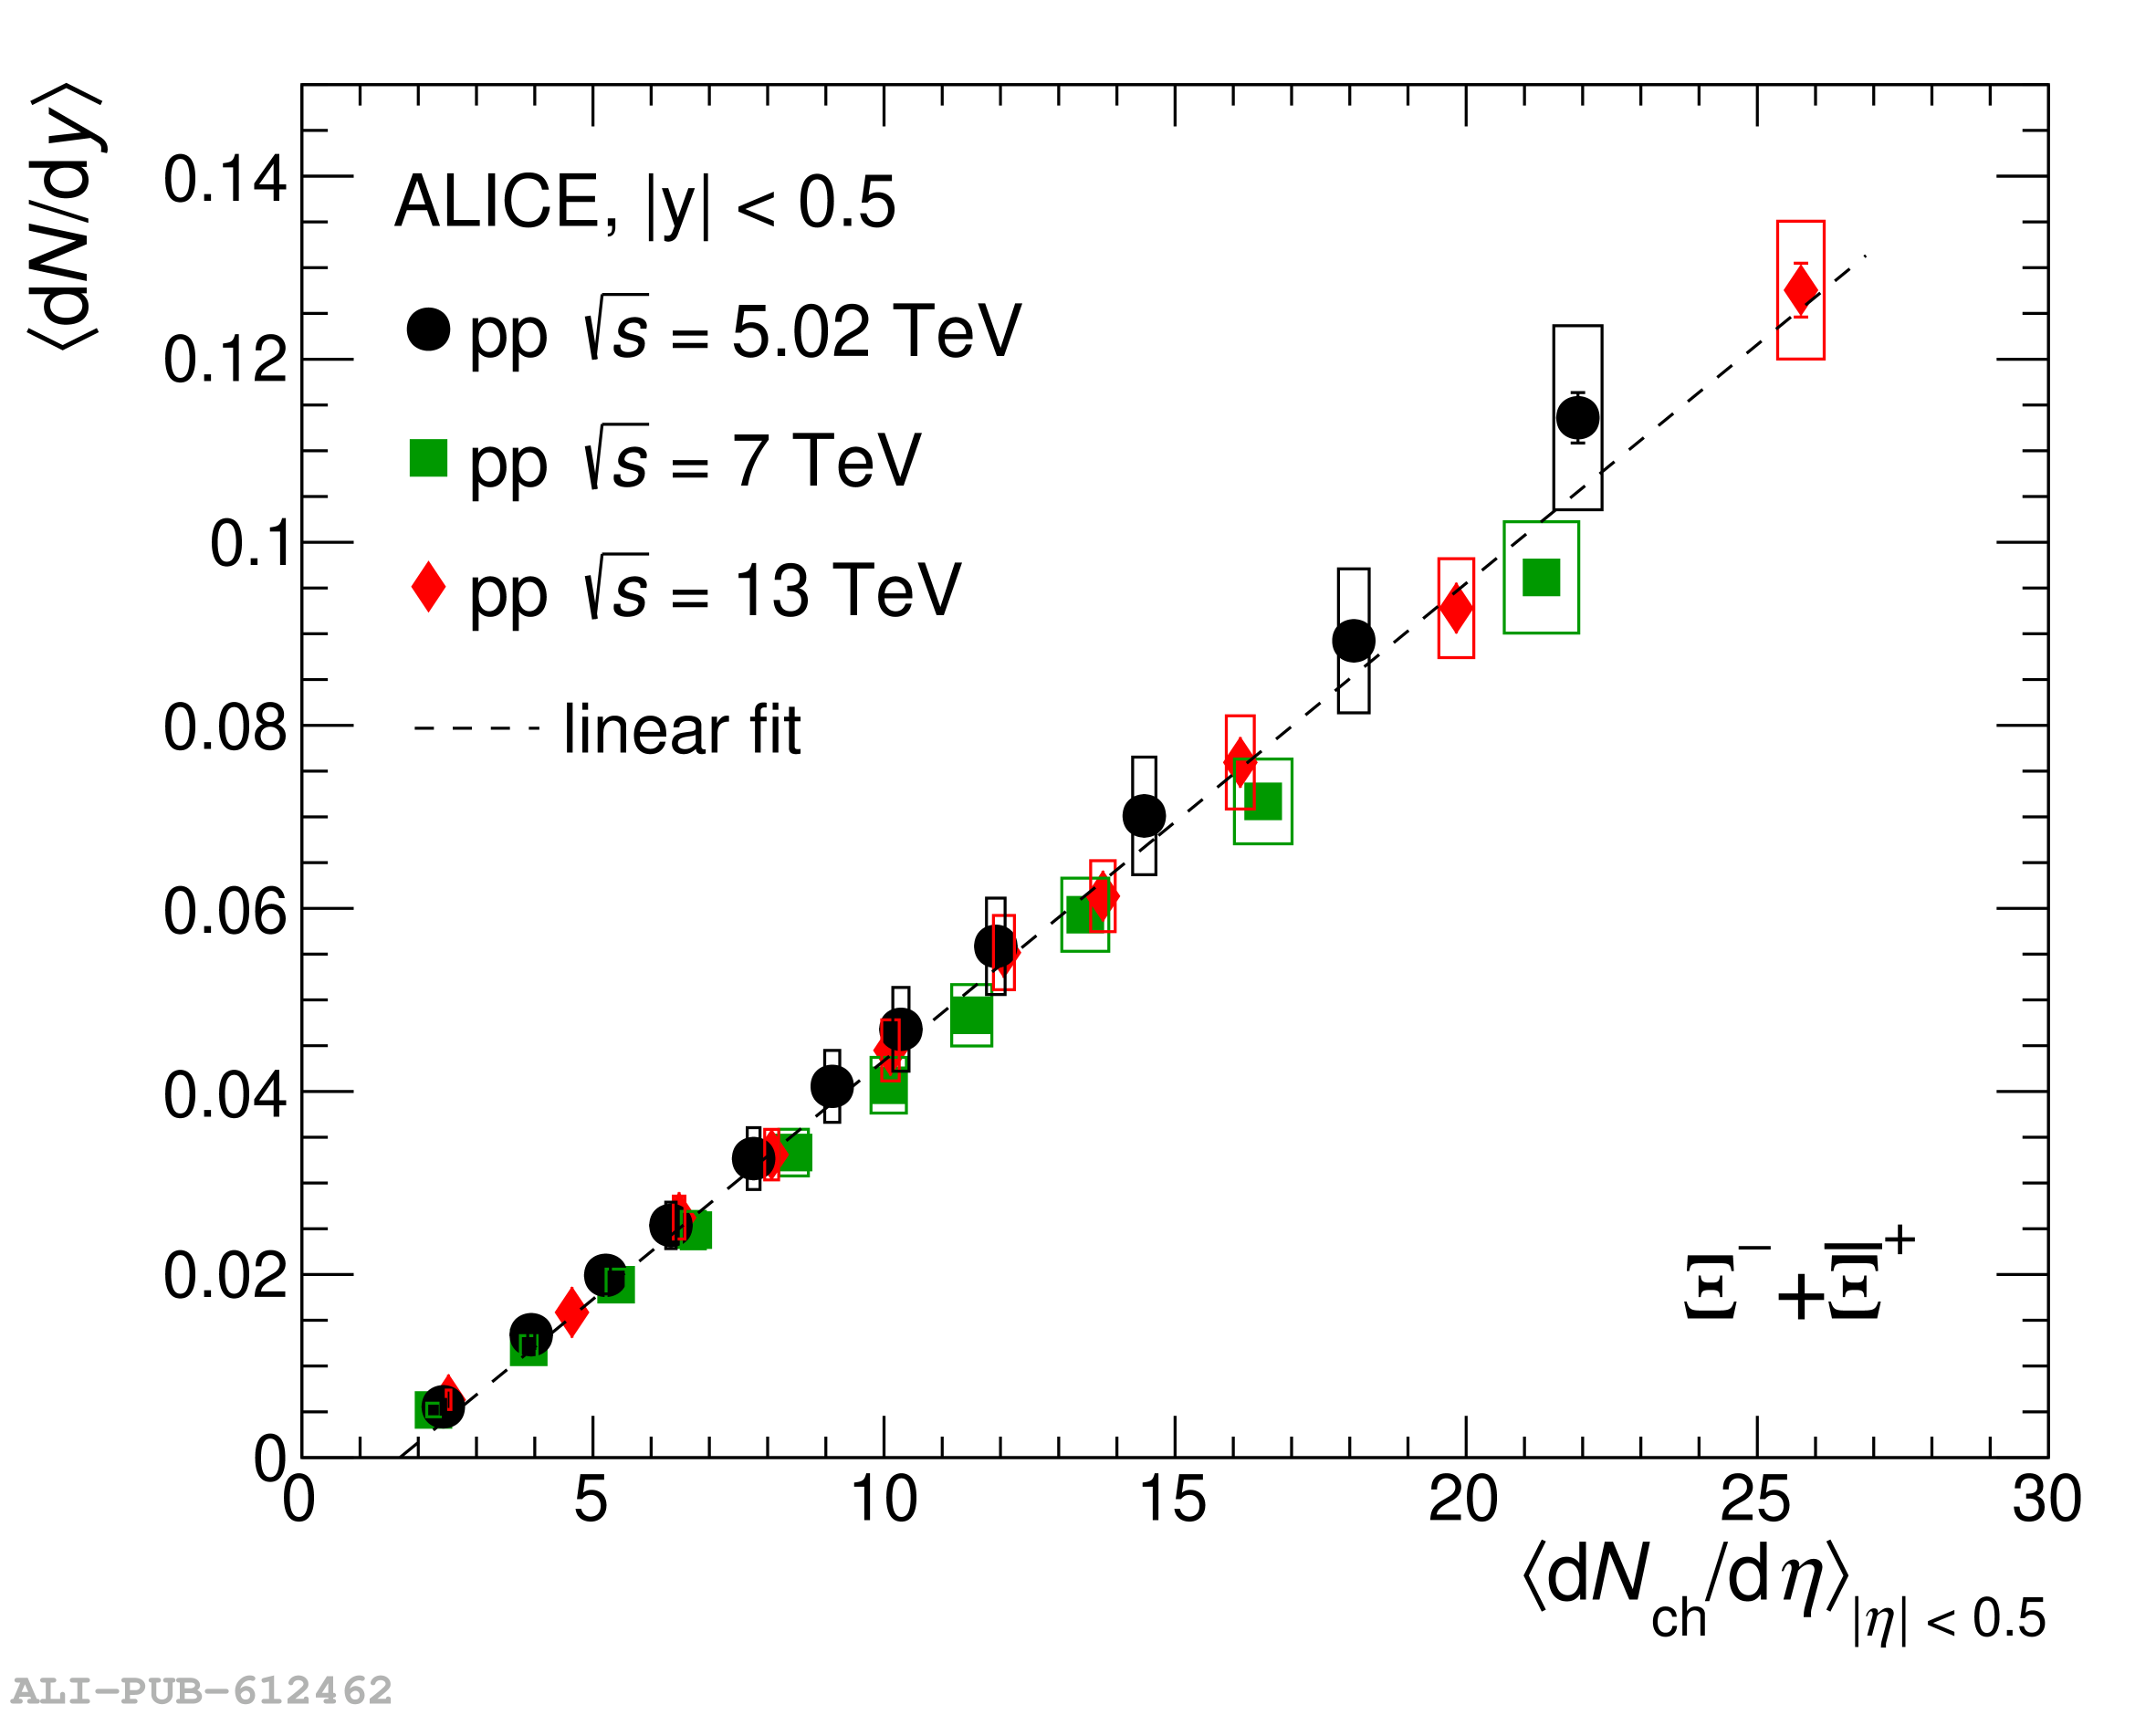 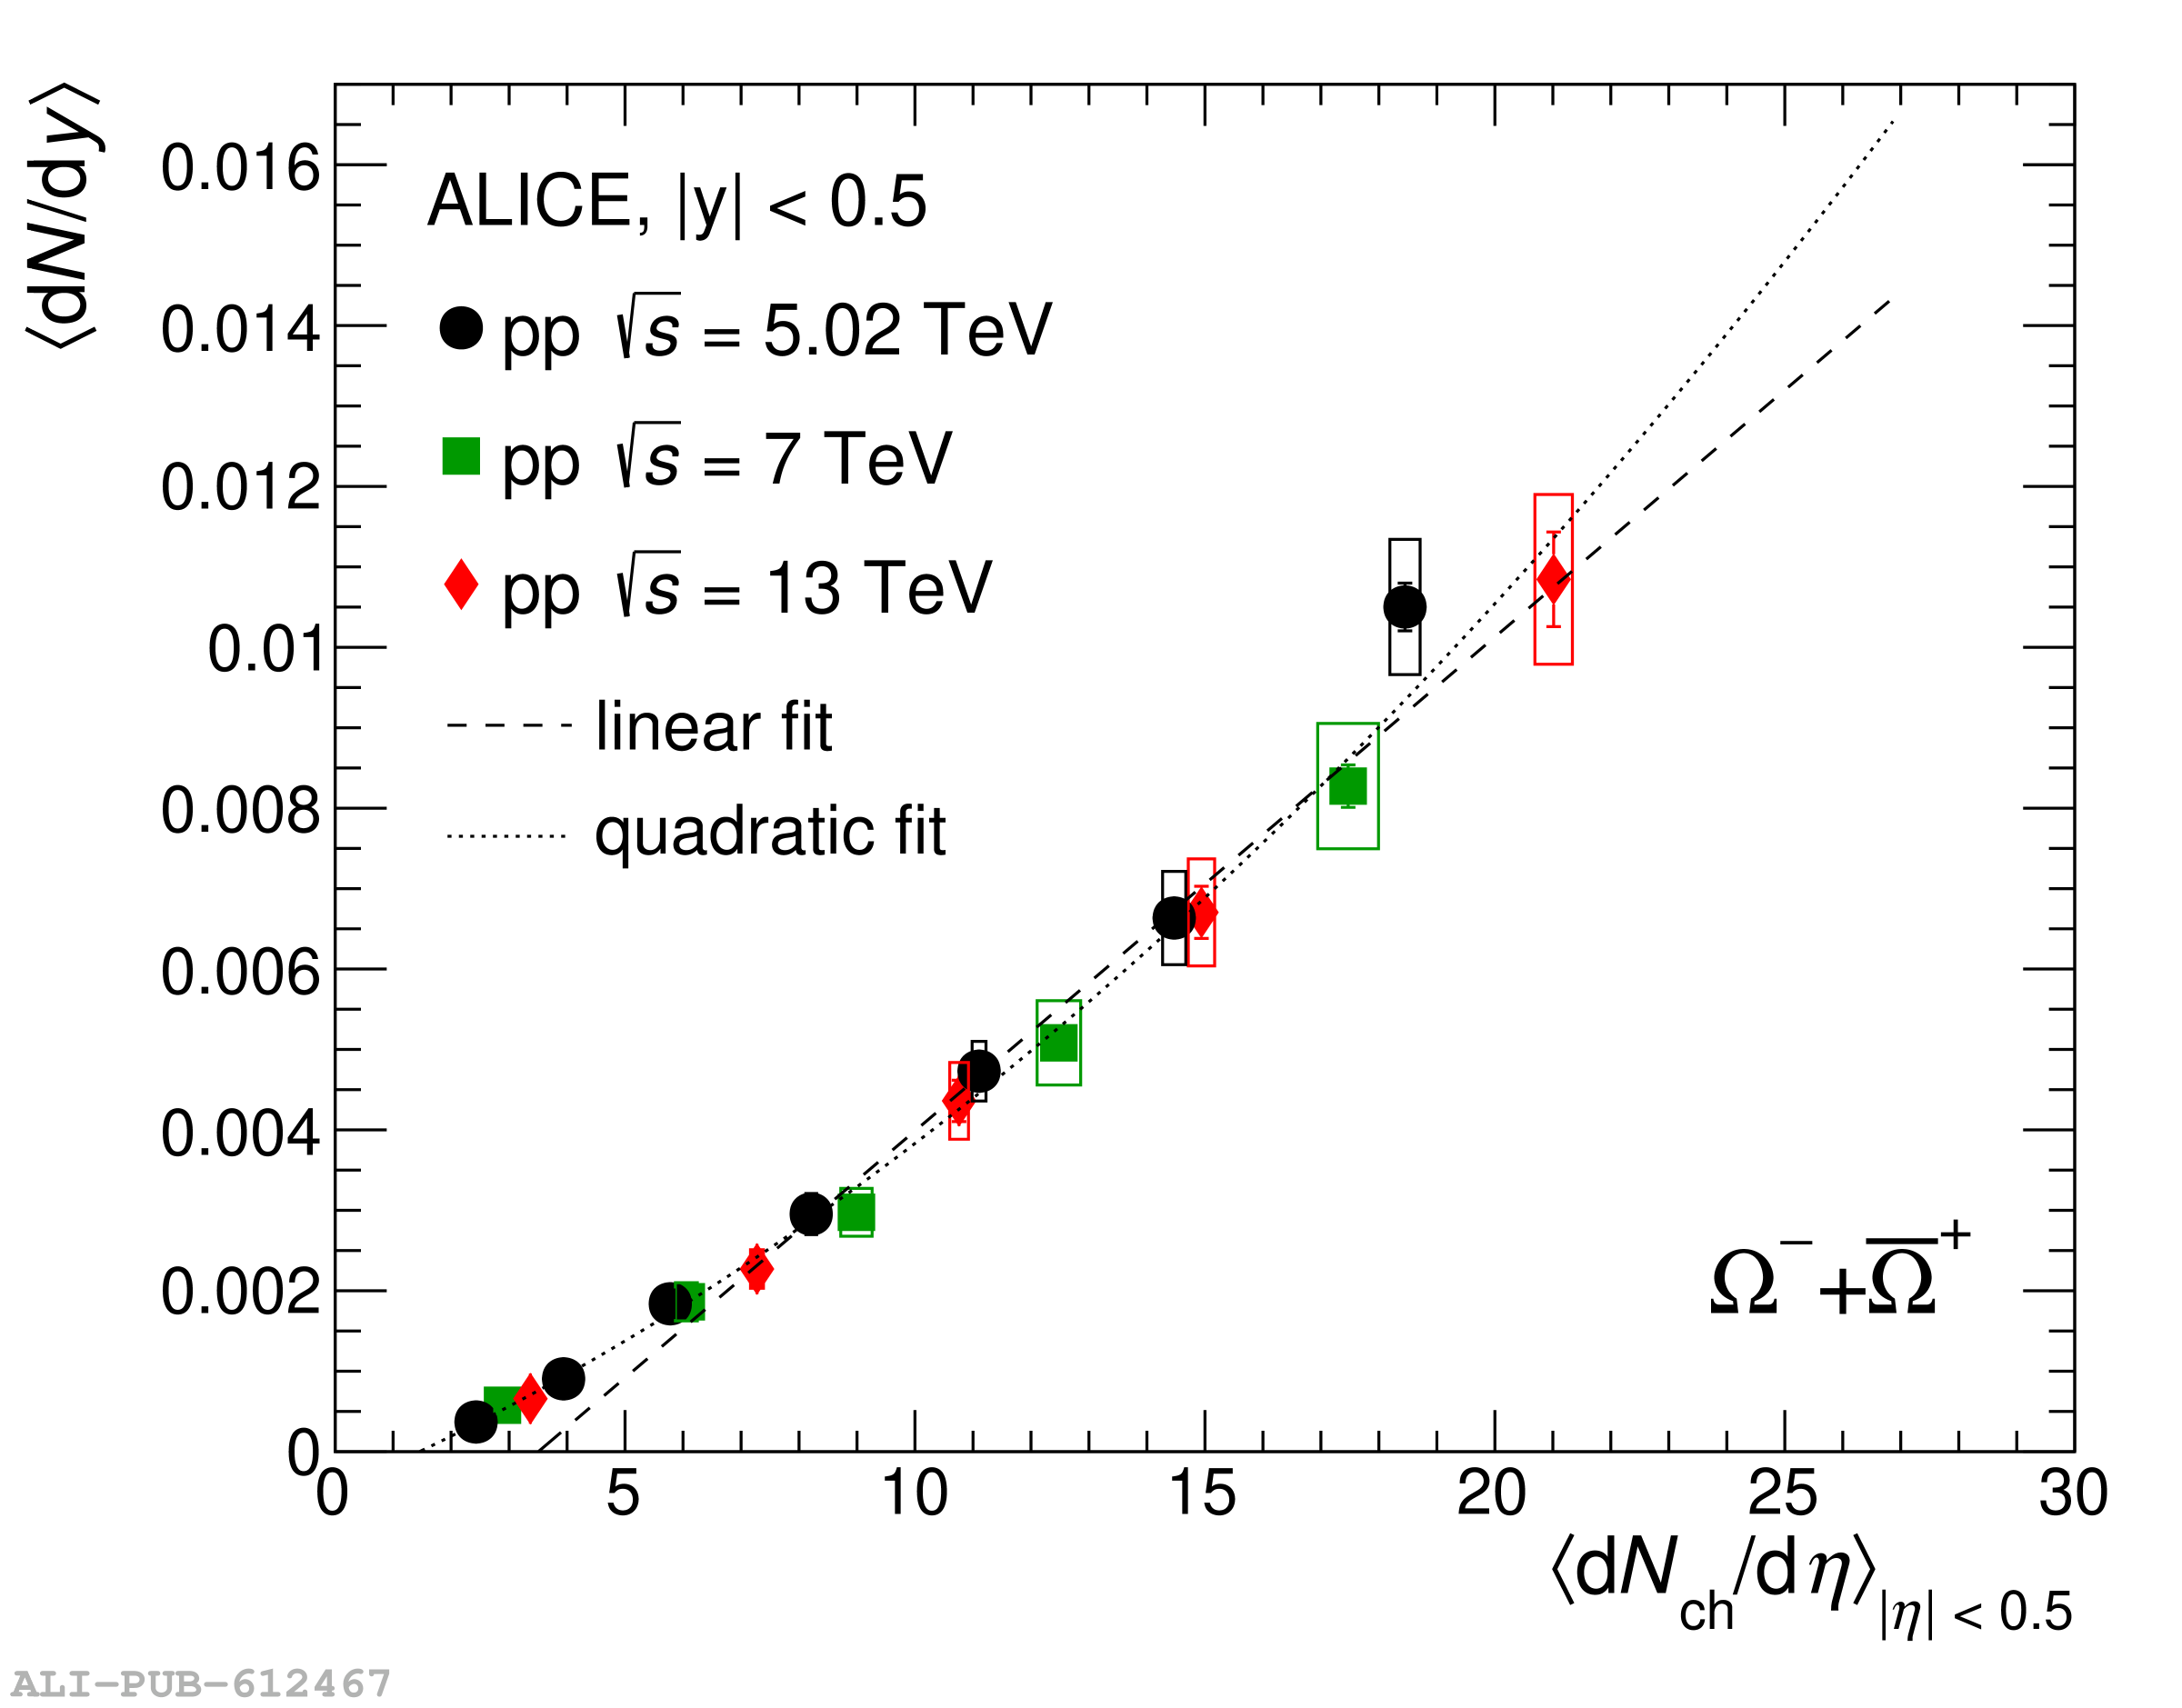 |
Figure 5
\pt-integrated yields (left column) and \avpt (right column) at $\sqrt{s}$ = 5.02 TeV for \kzero, \lmb, \Xiboth, and \Omboth compared with MC generators PYTHIA 8 Monash 2013 (, dashed line), PYTHIA 8 QCD-CR+Ropes (, long-dashed line), DCCI (, dotted line) and EPOS 4 (, dash-dotted line). | 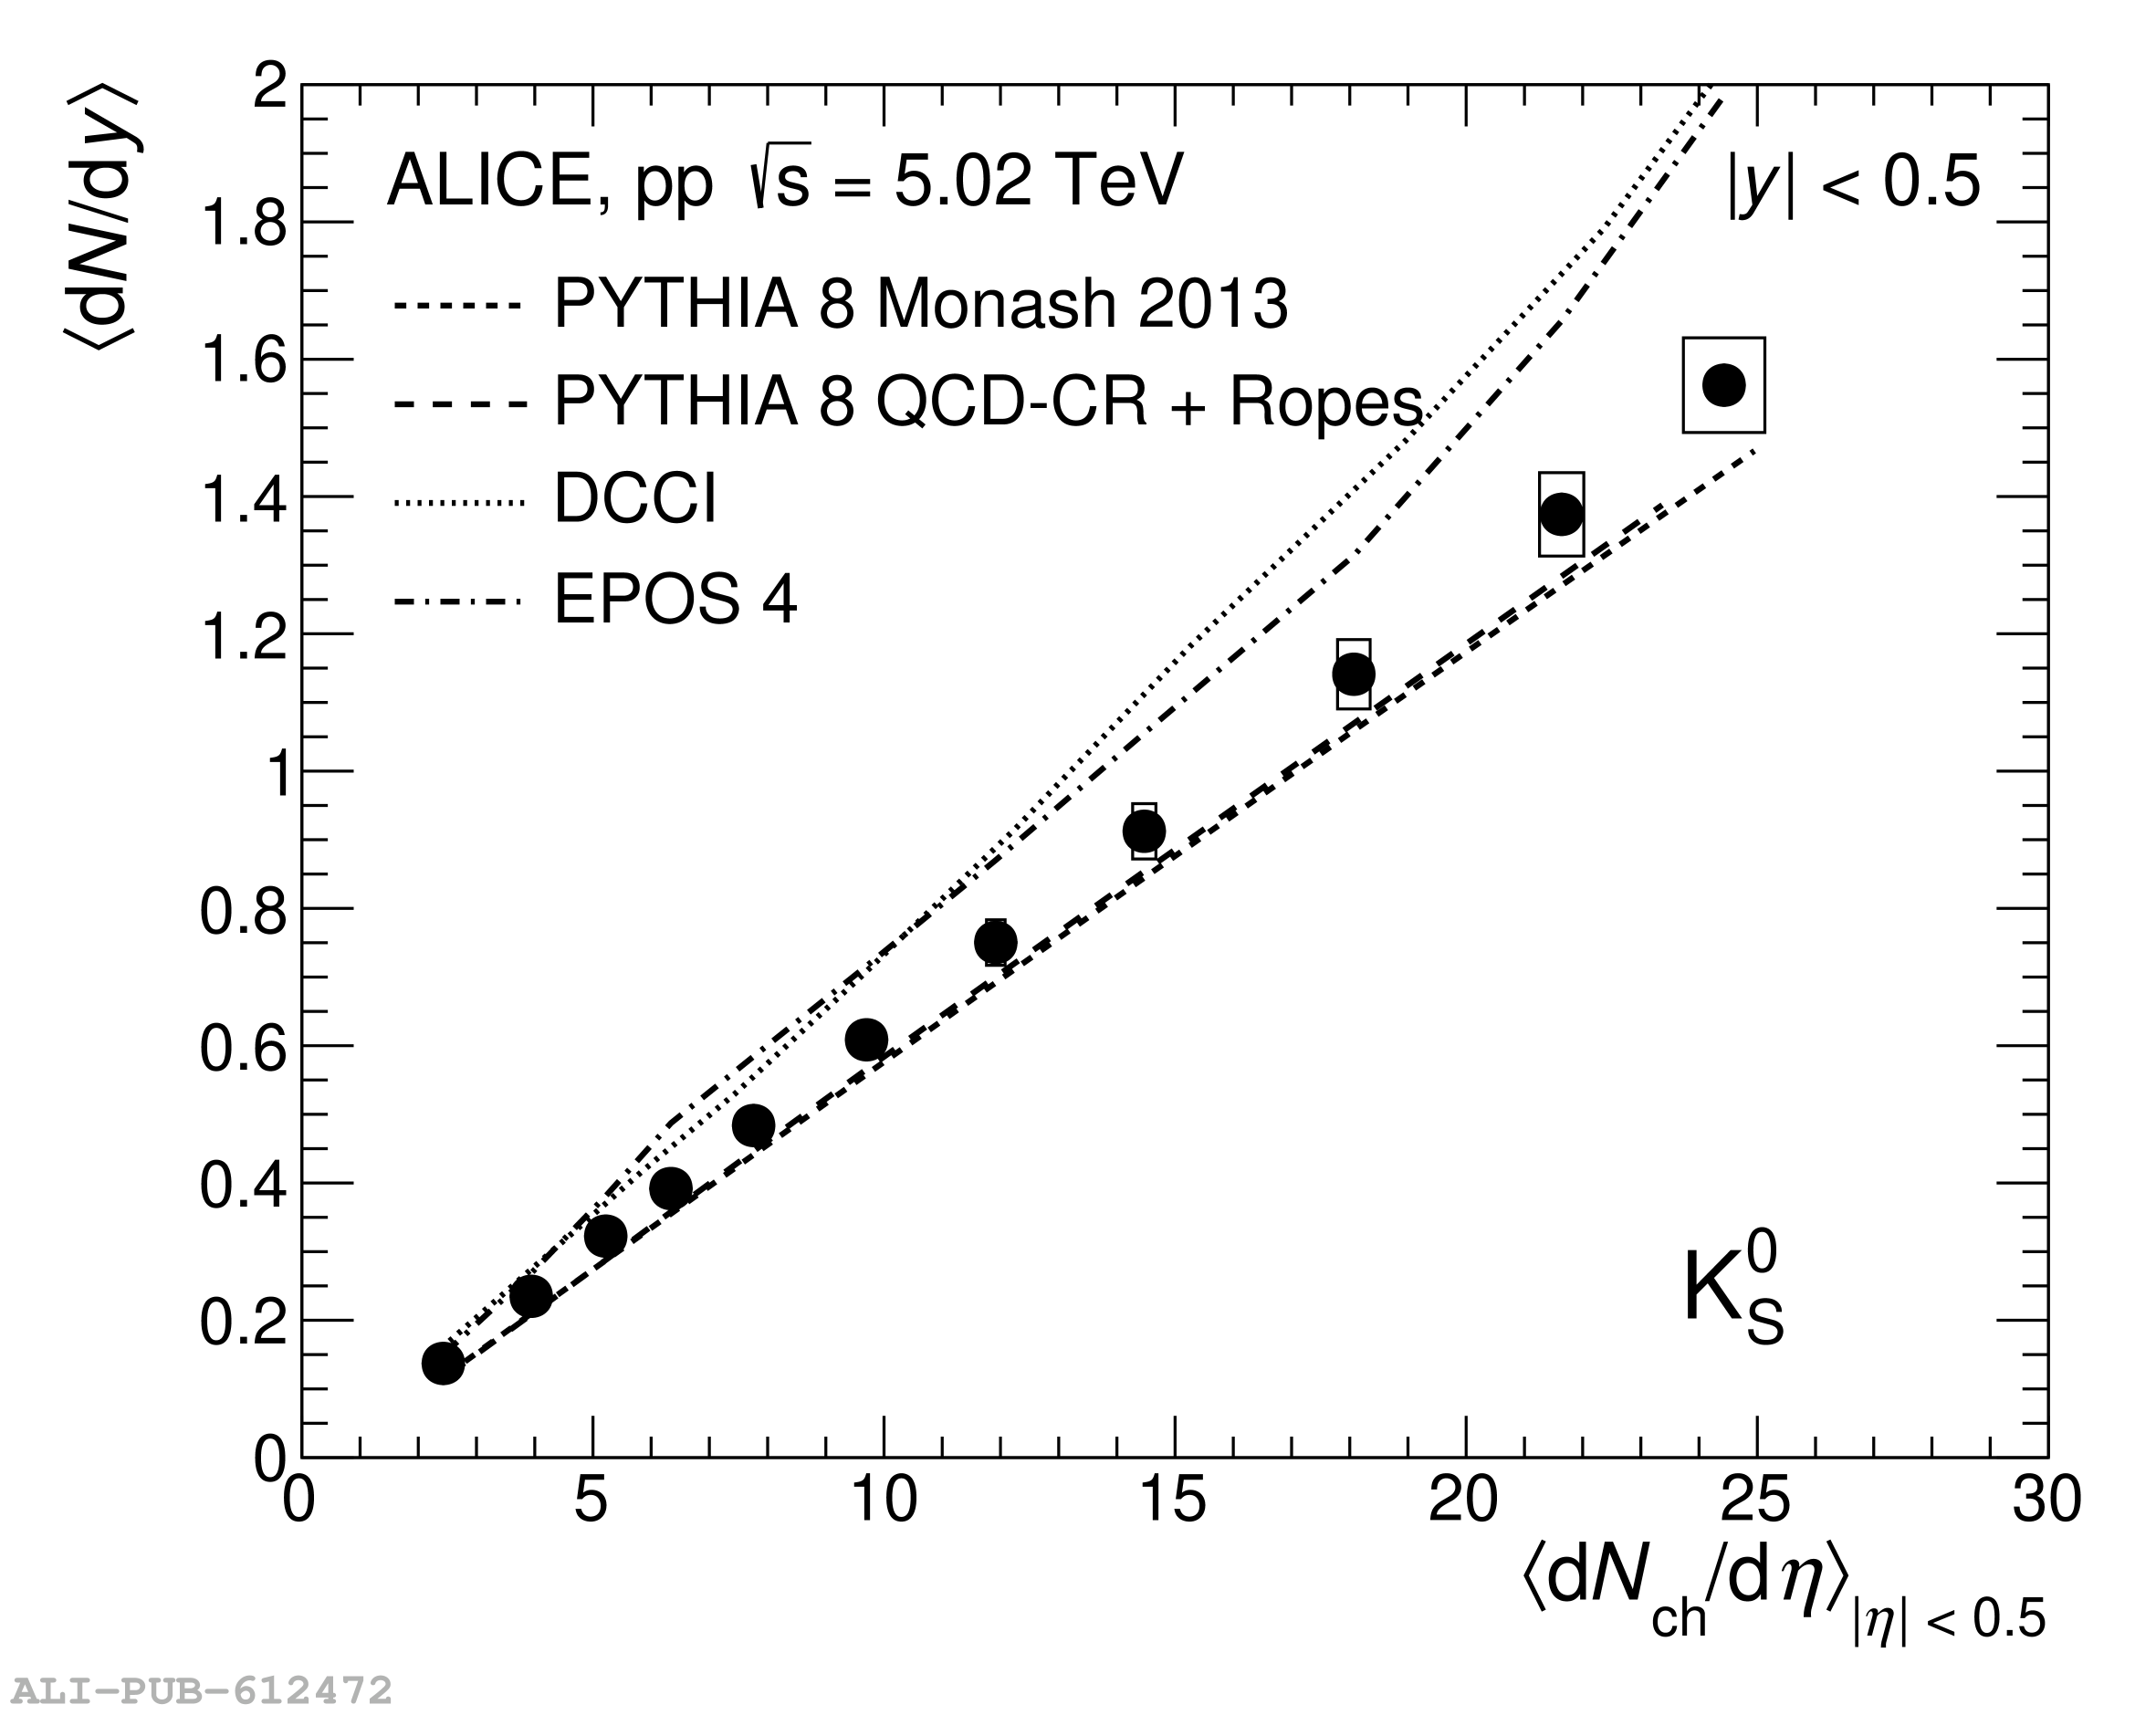 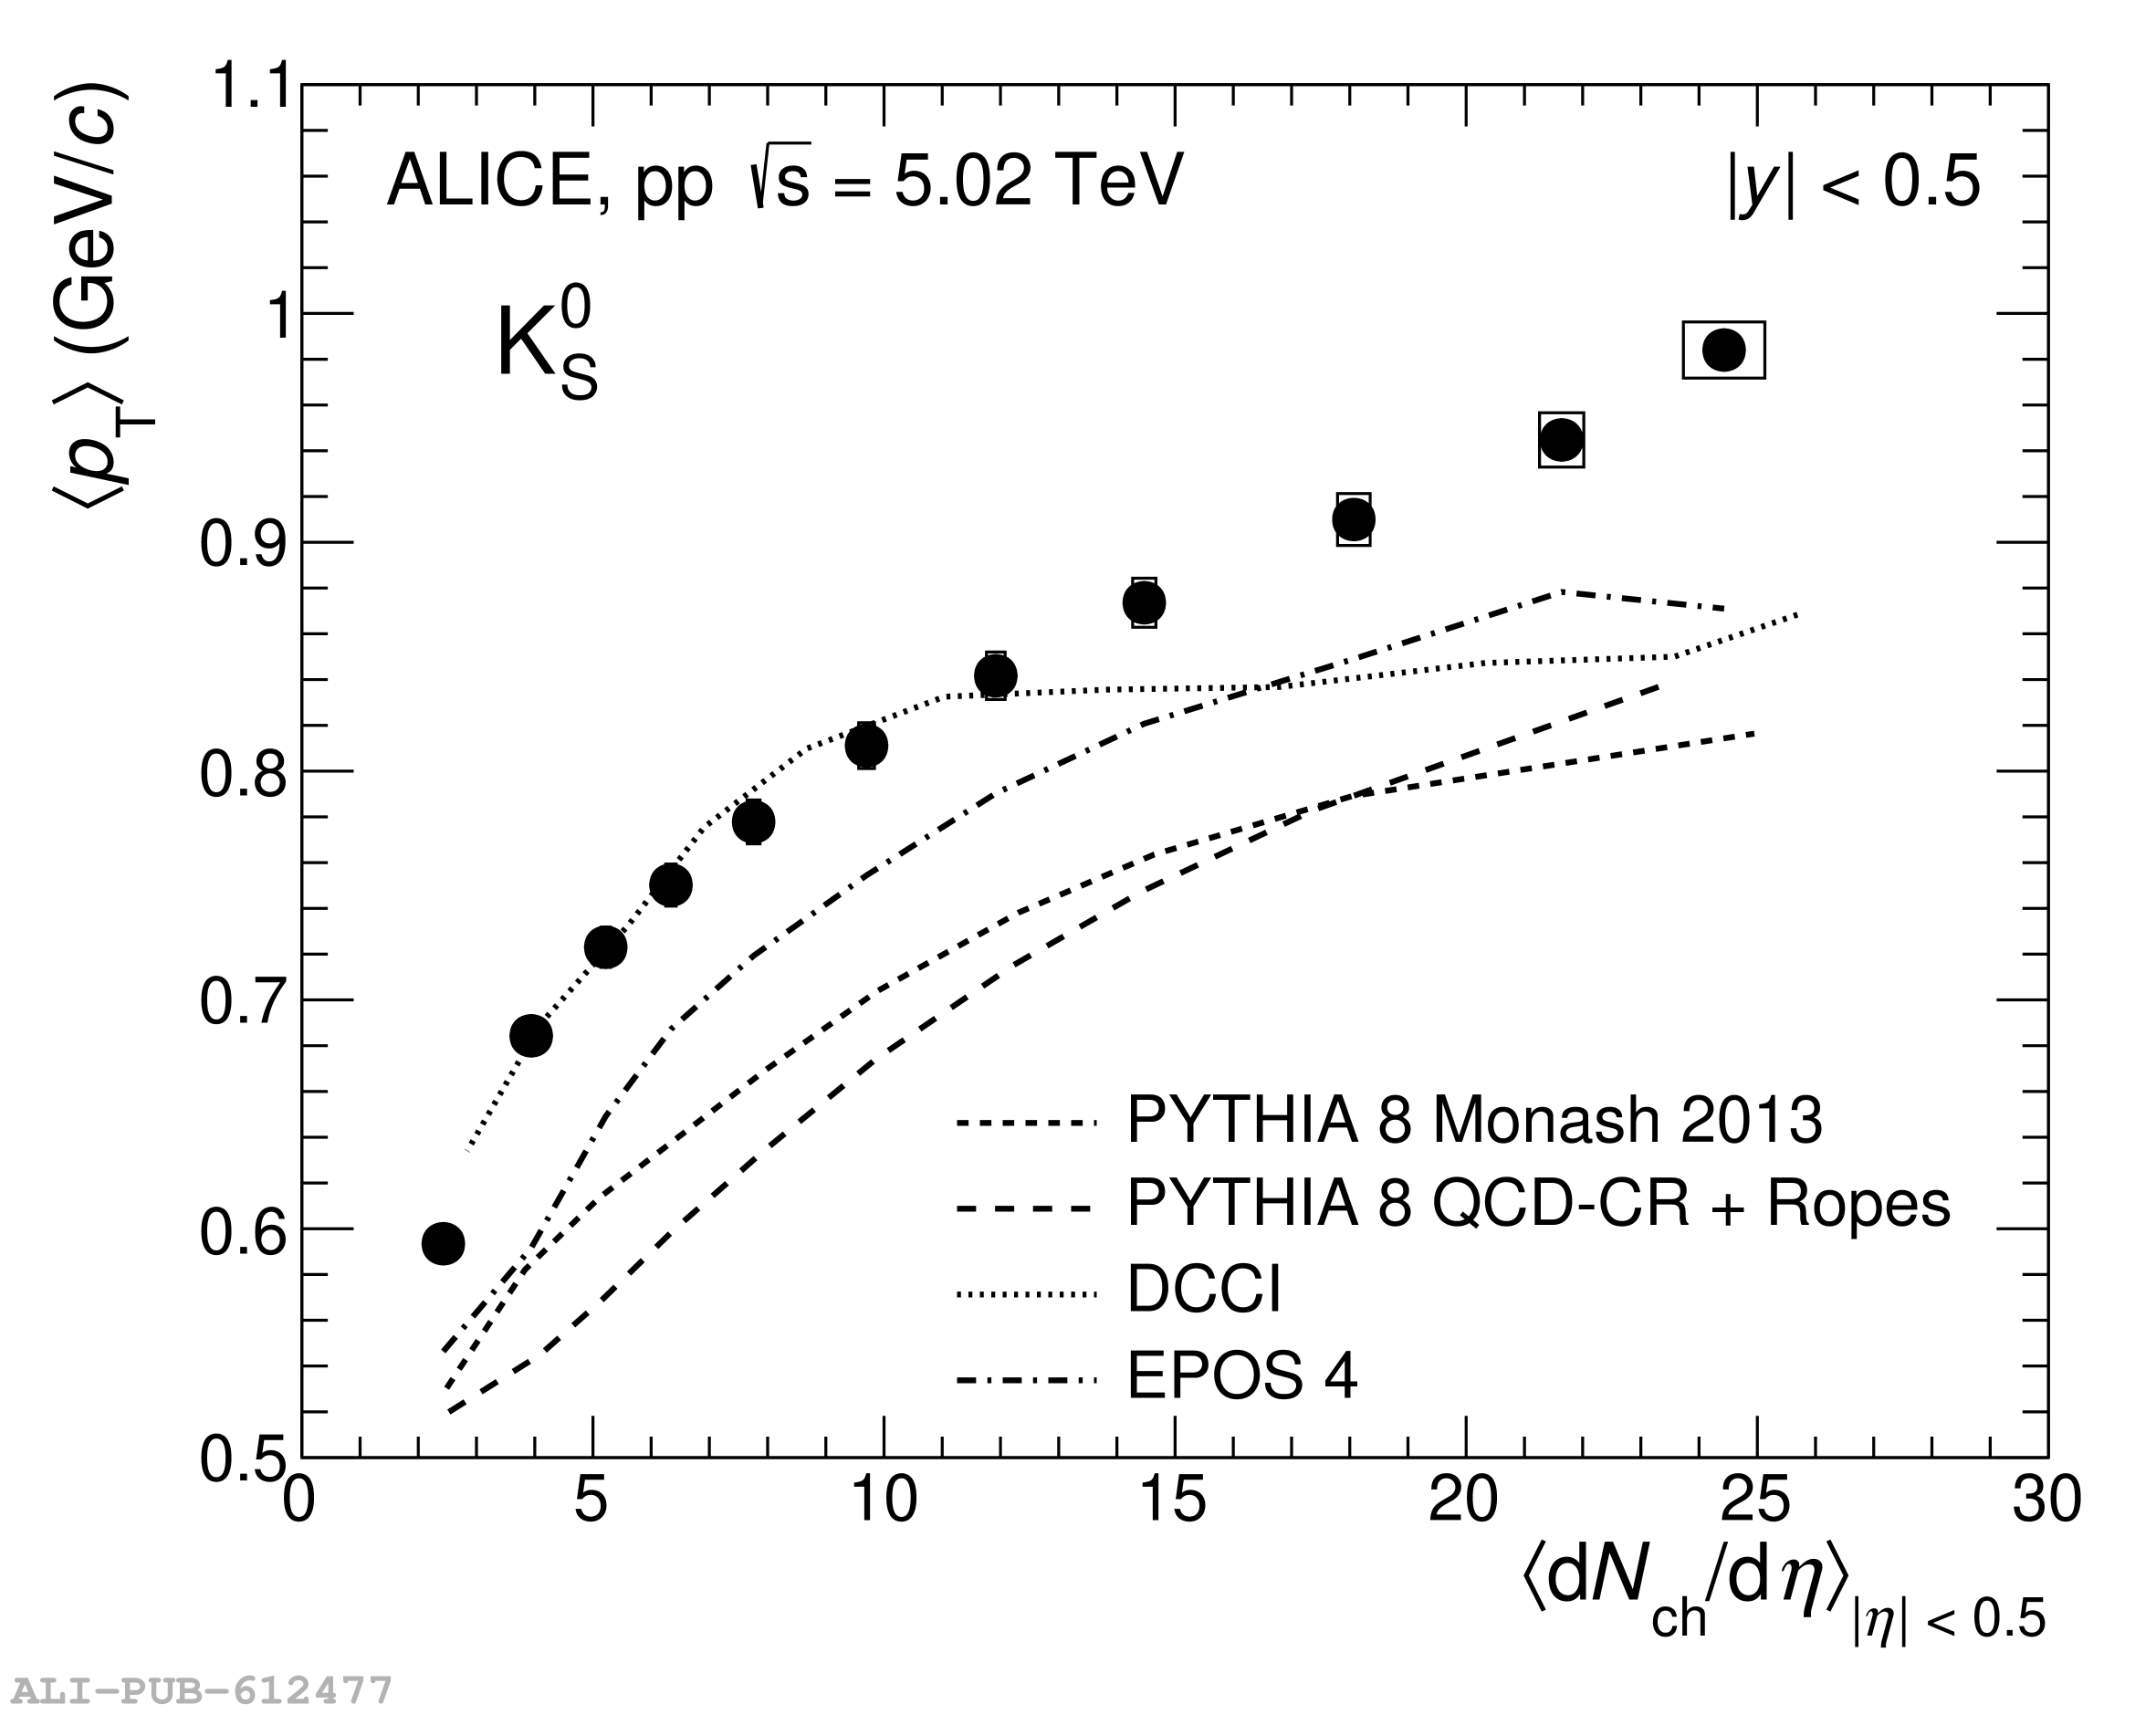 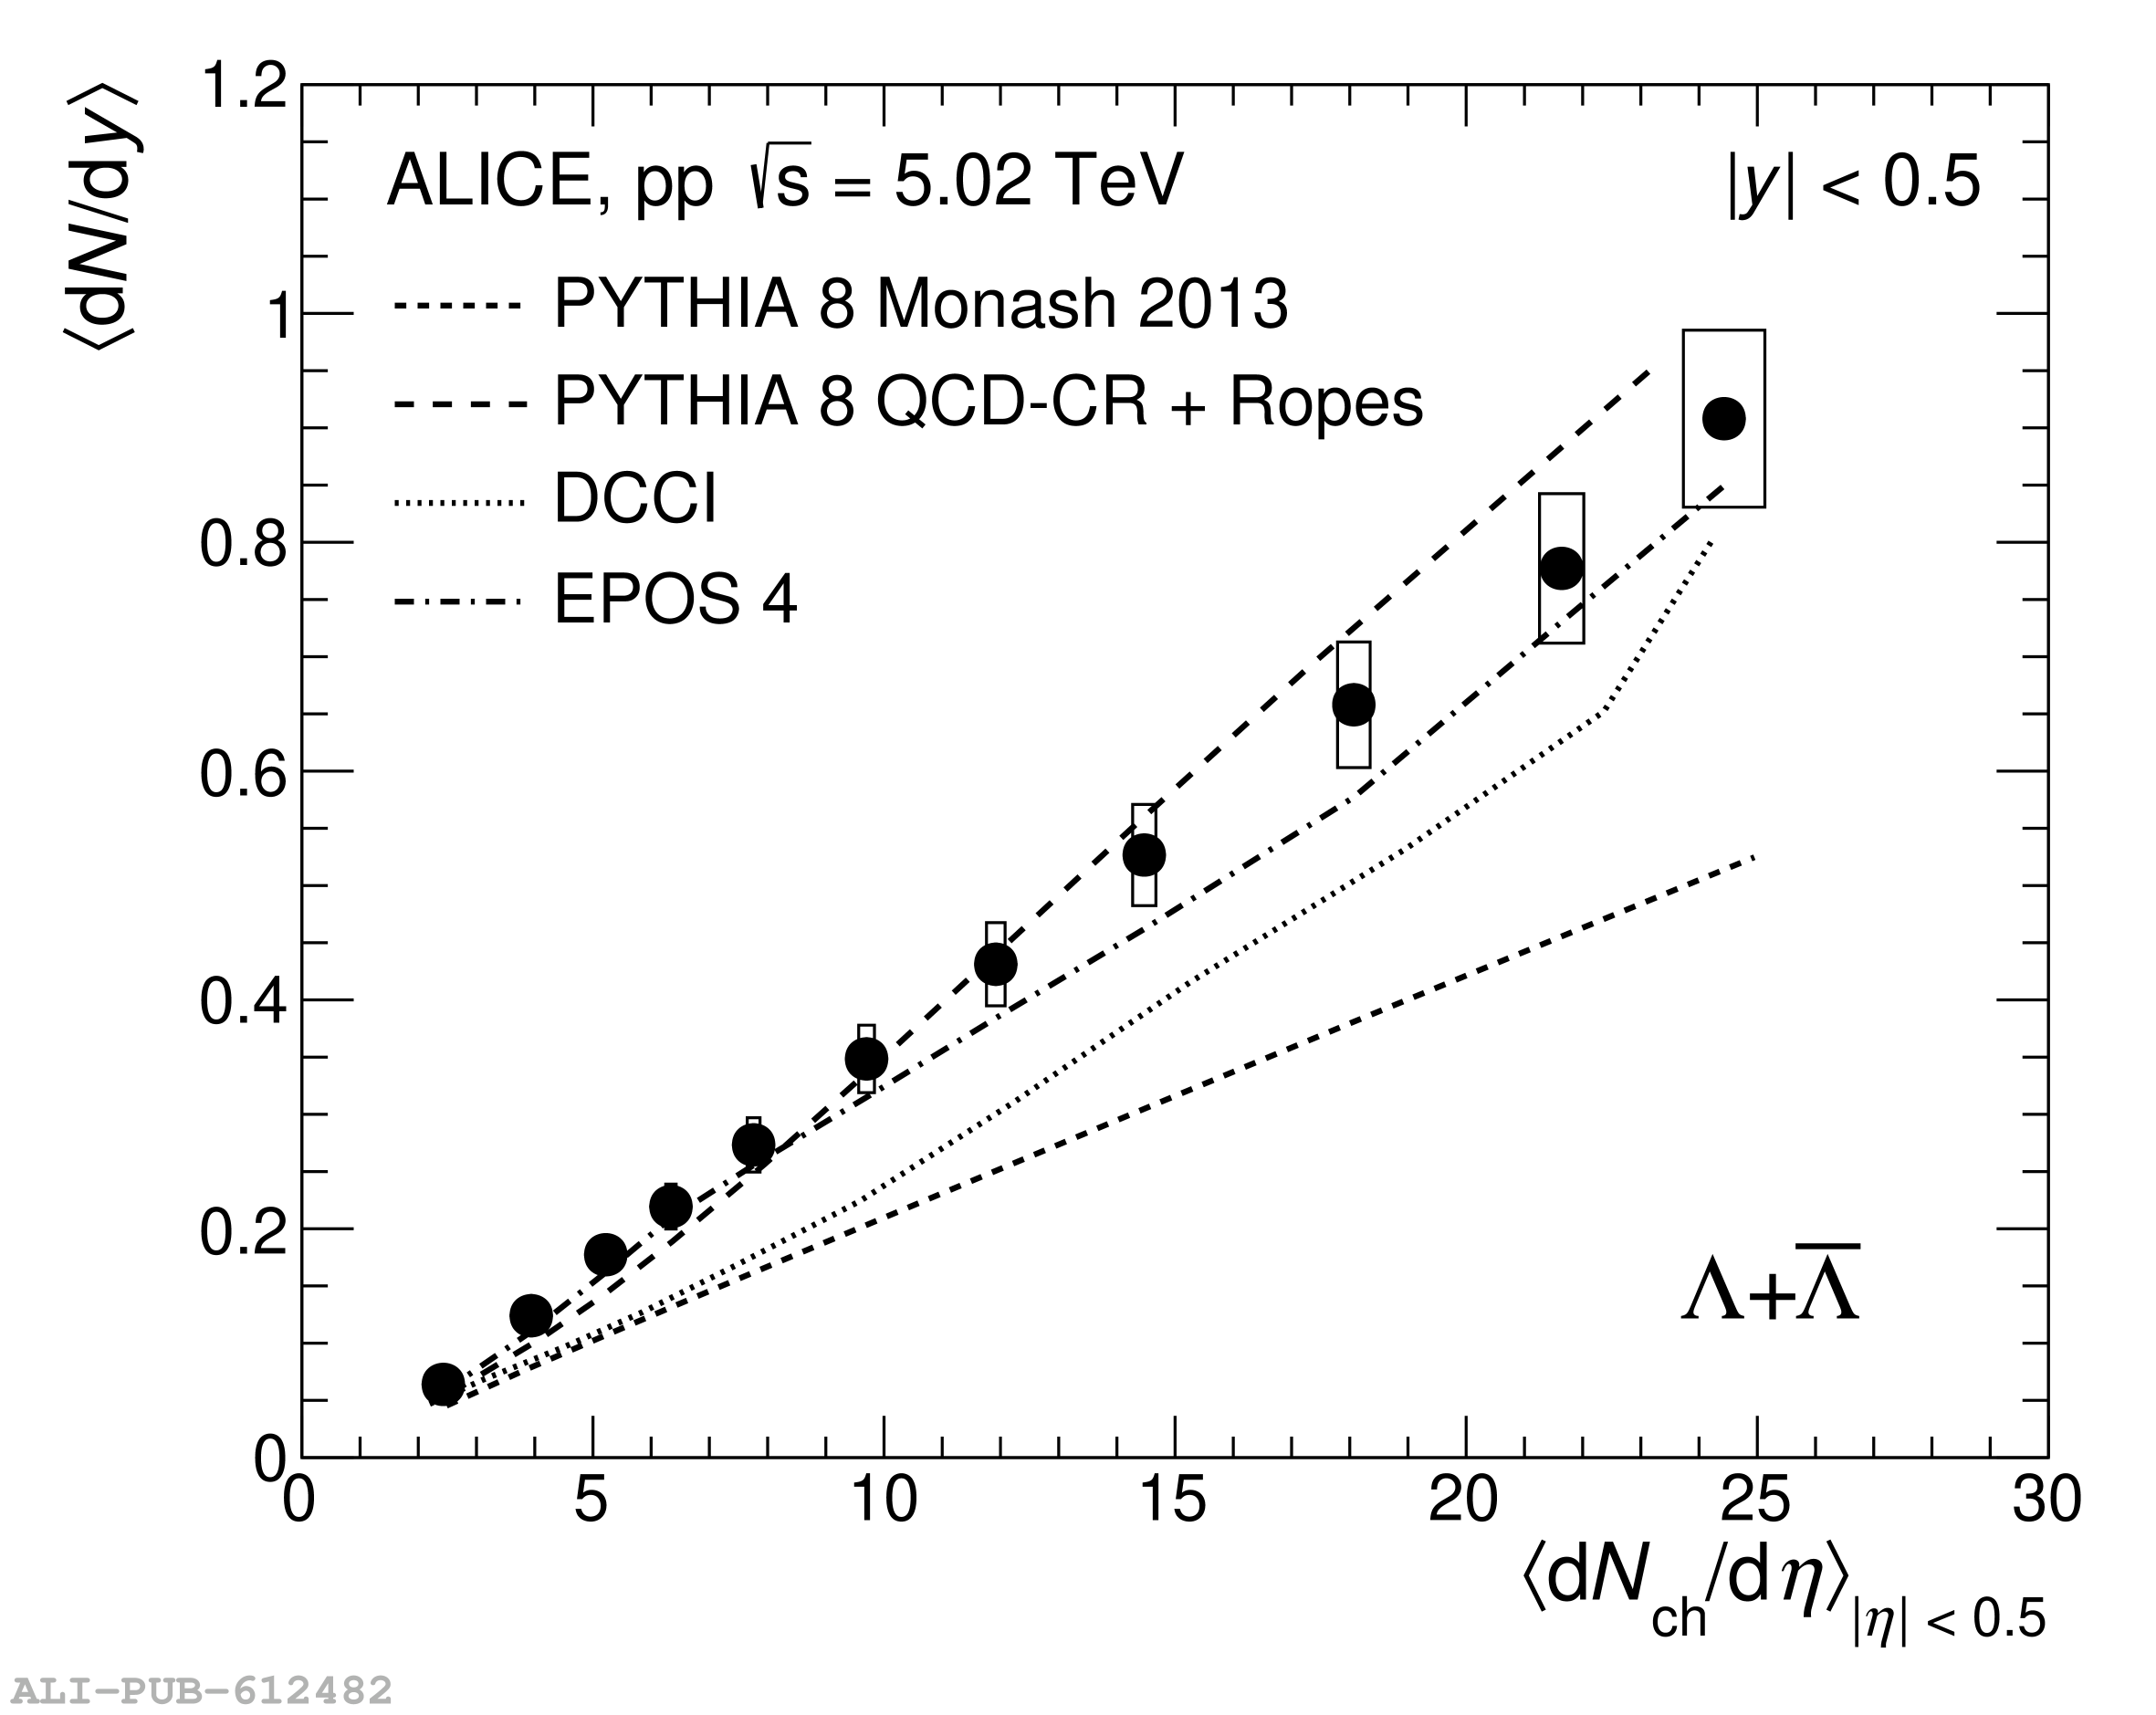 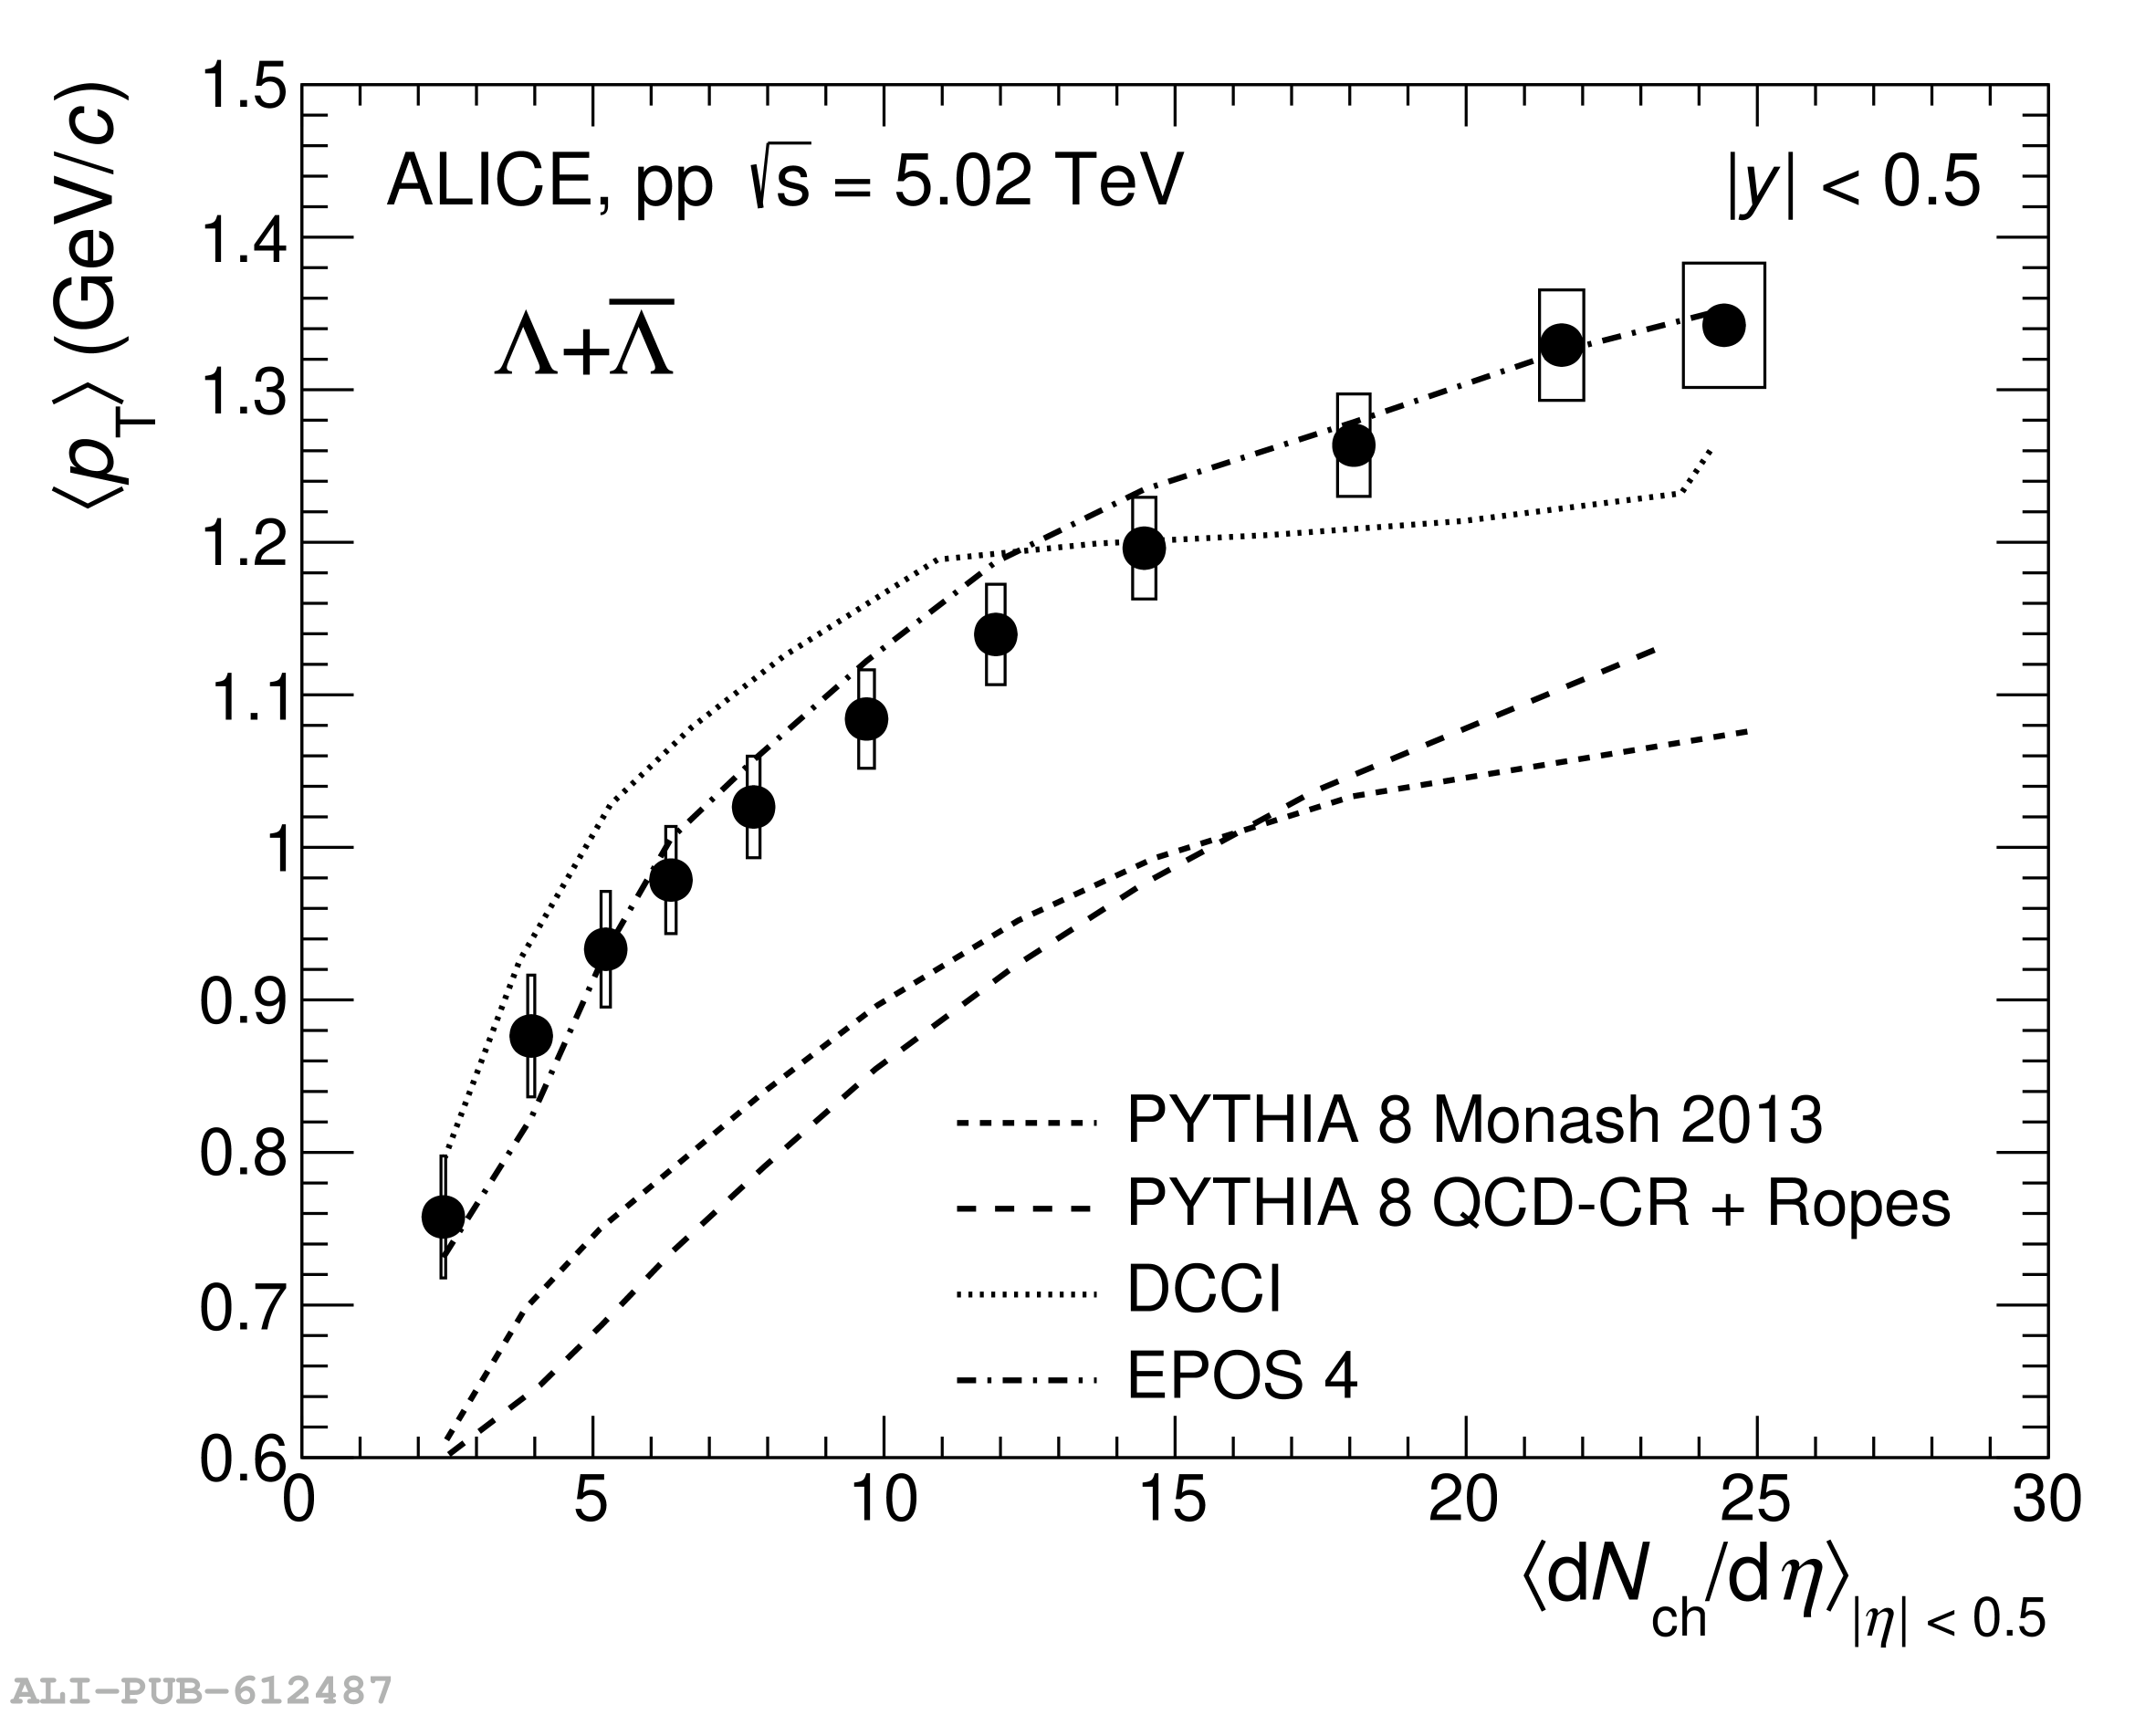 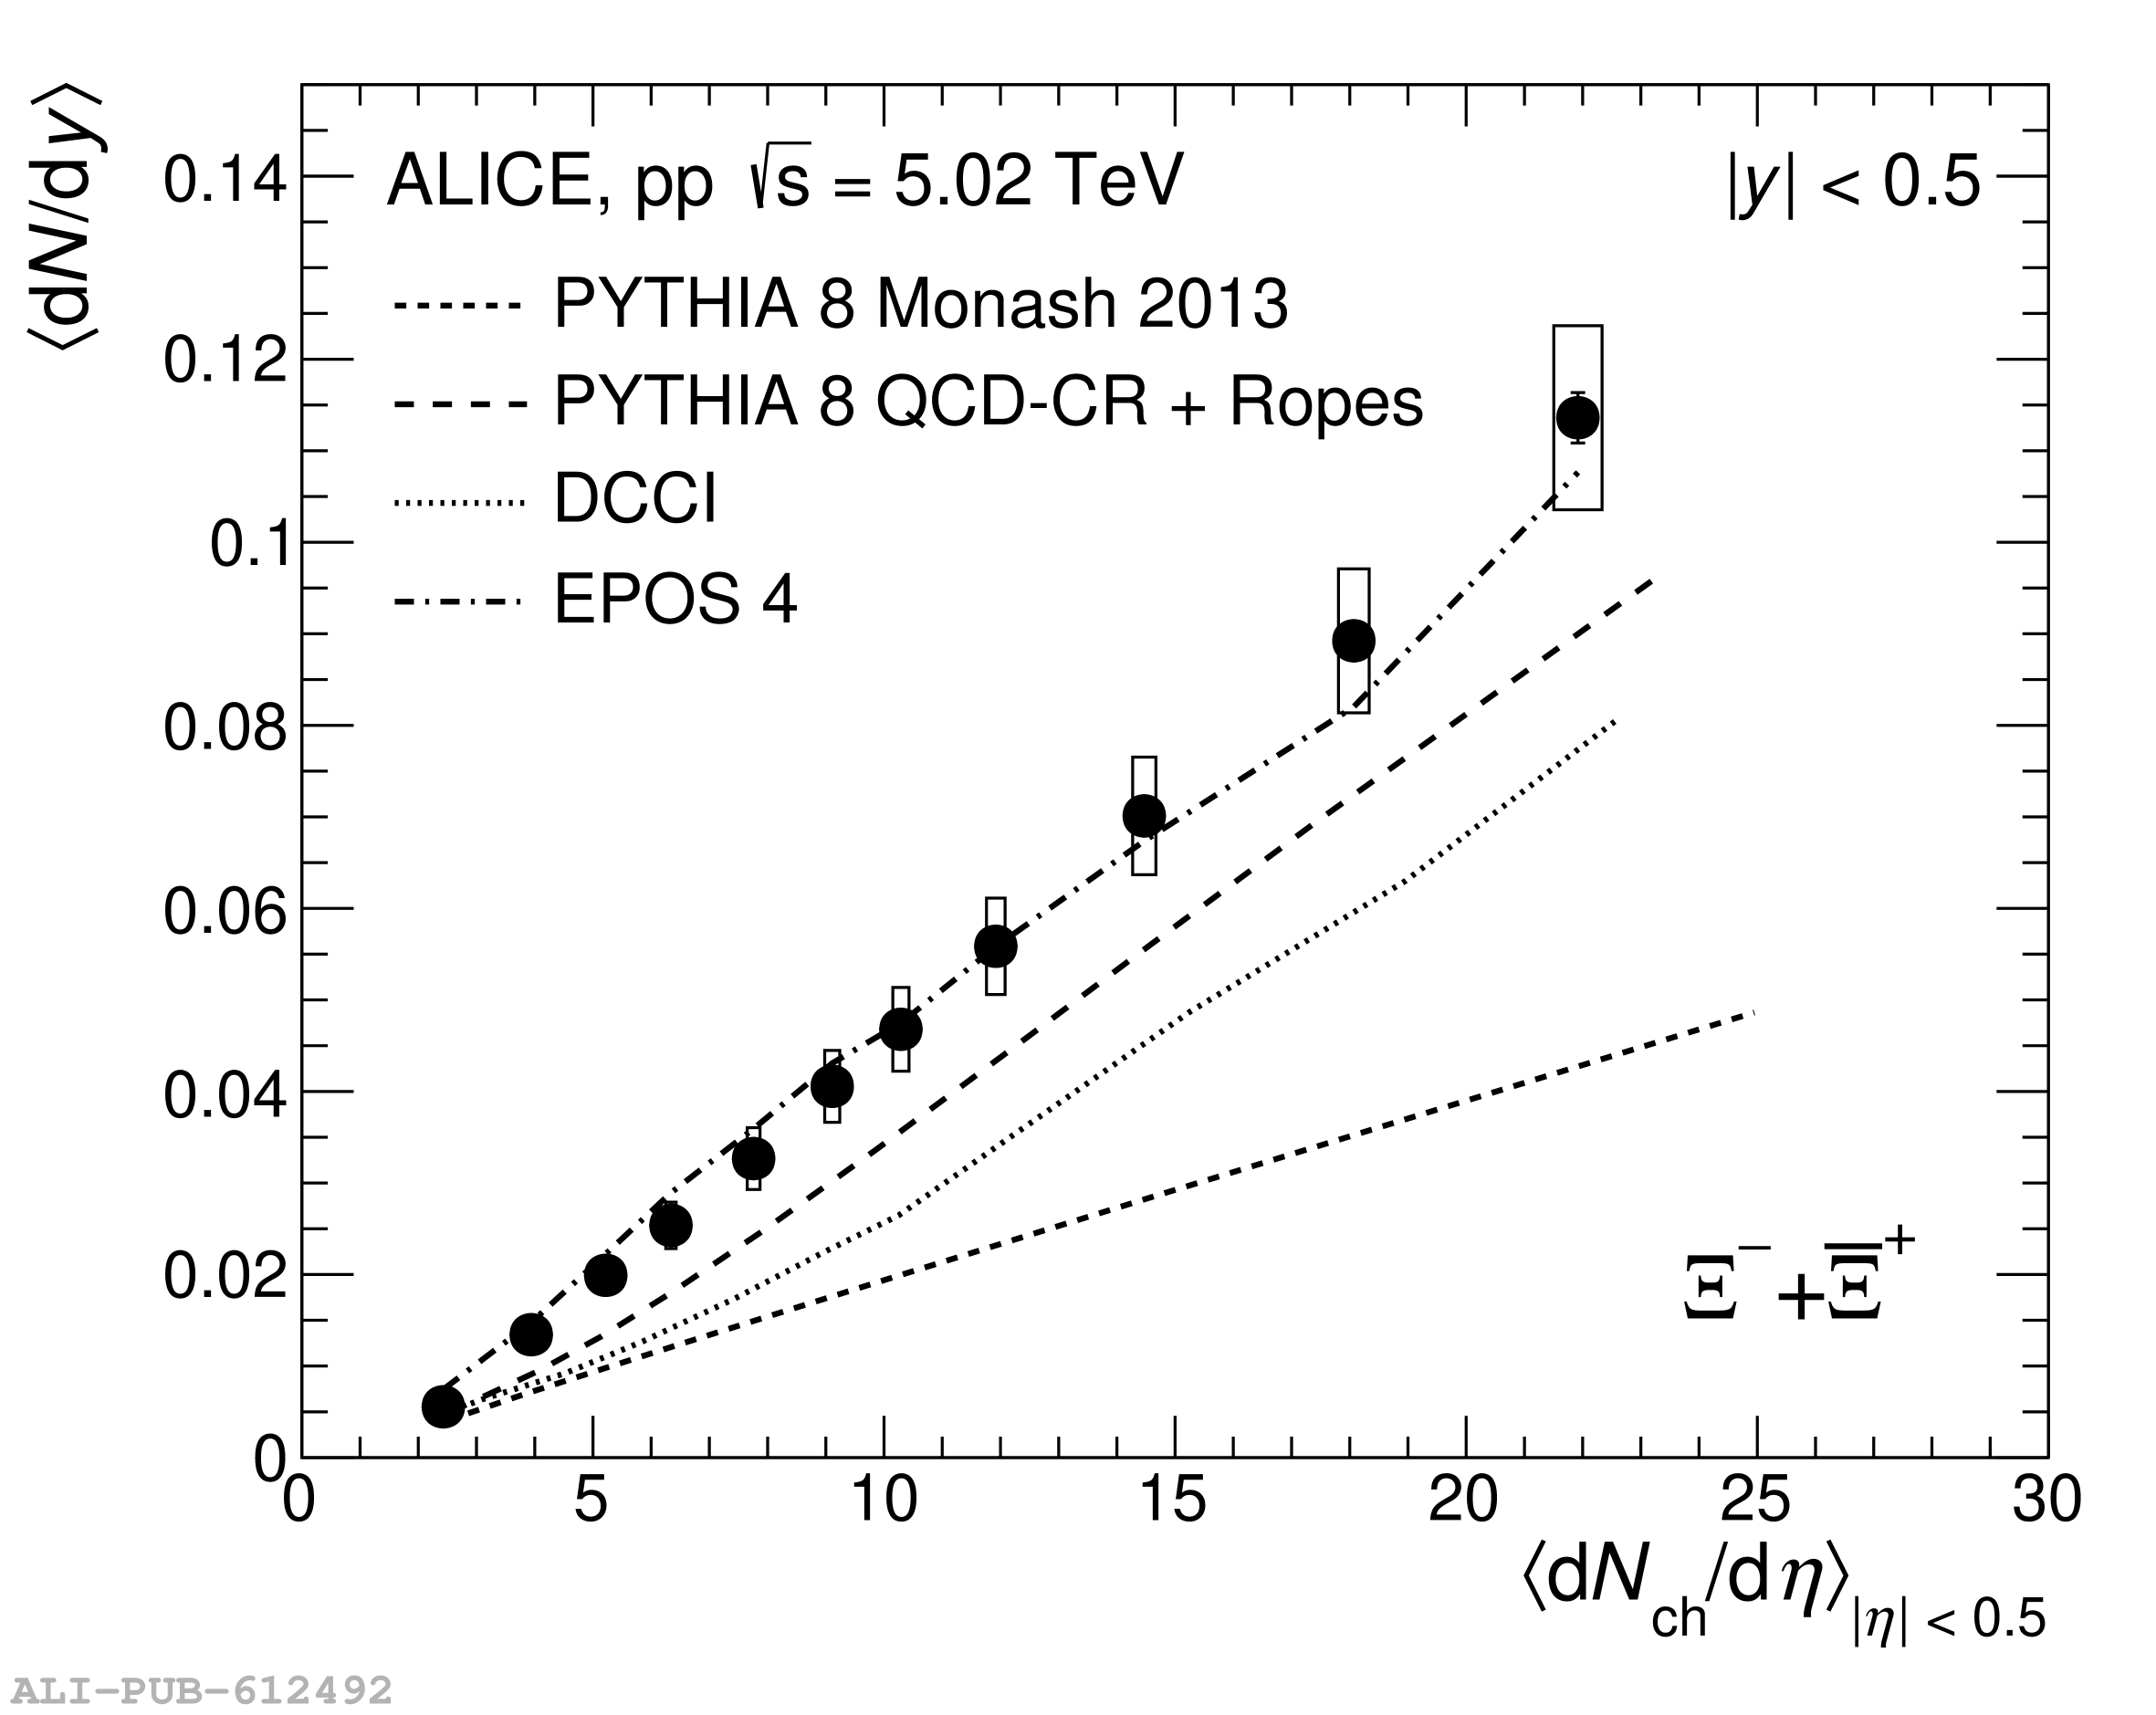 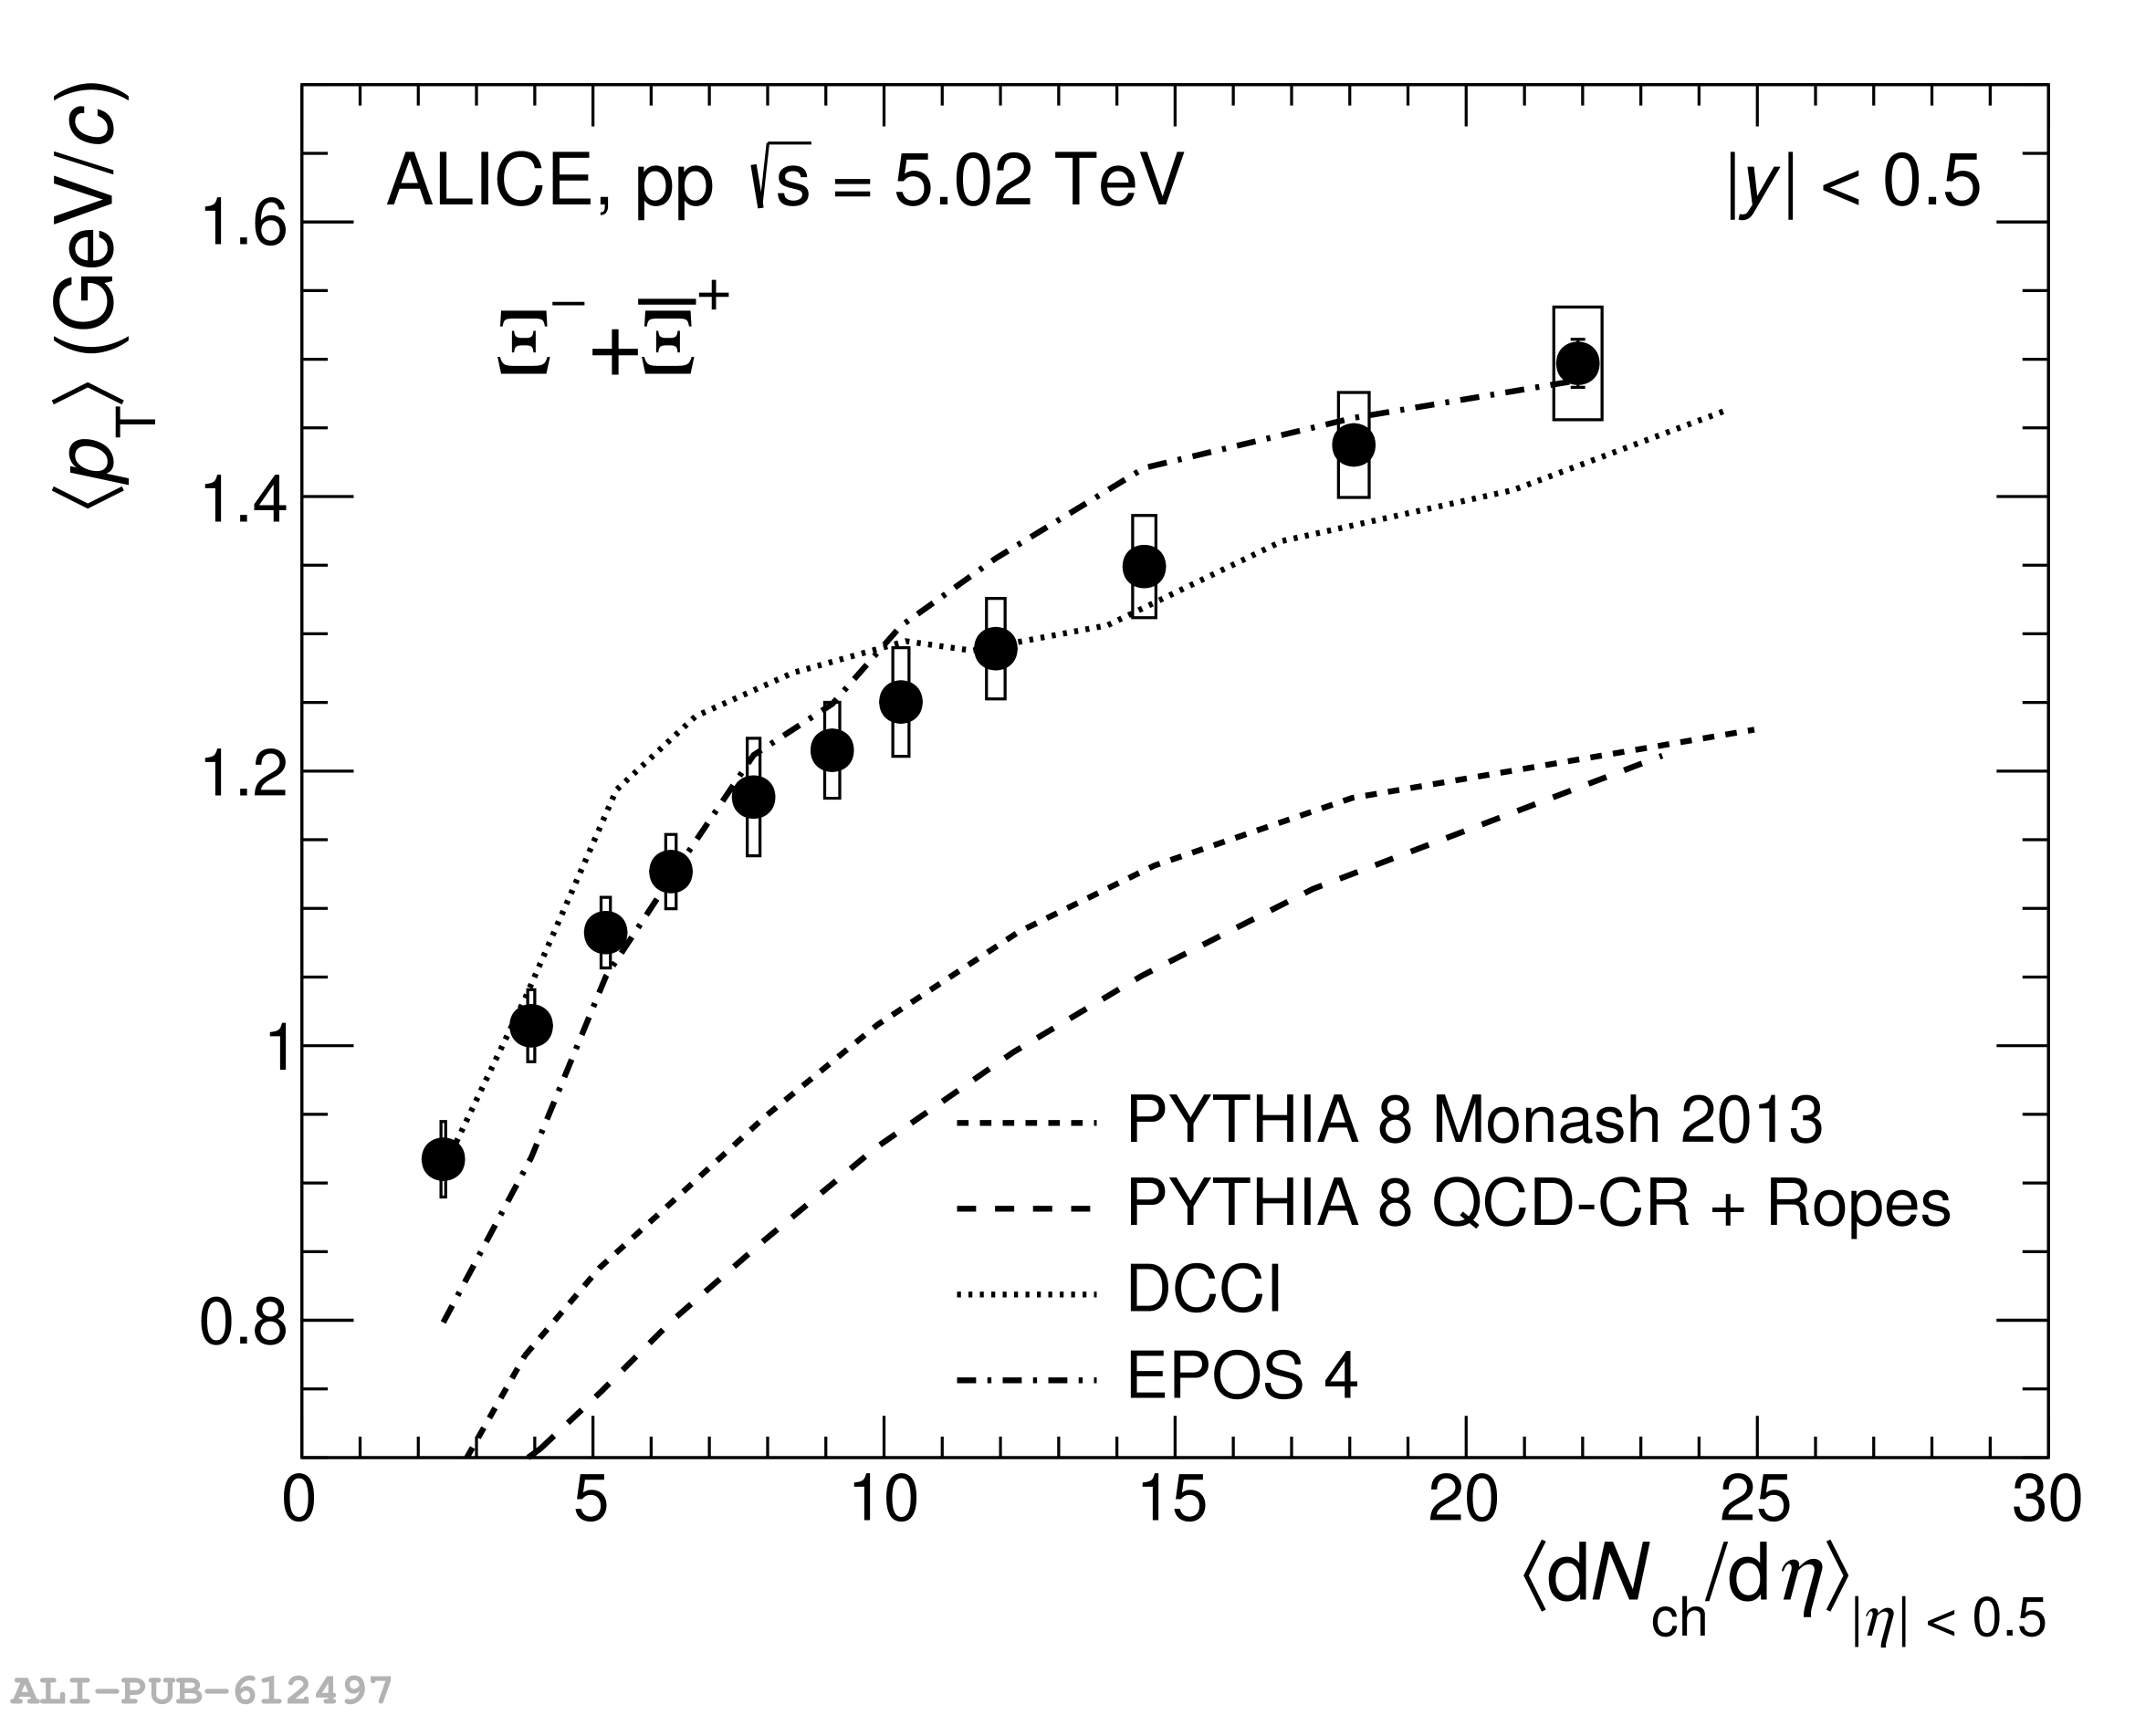 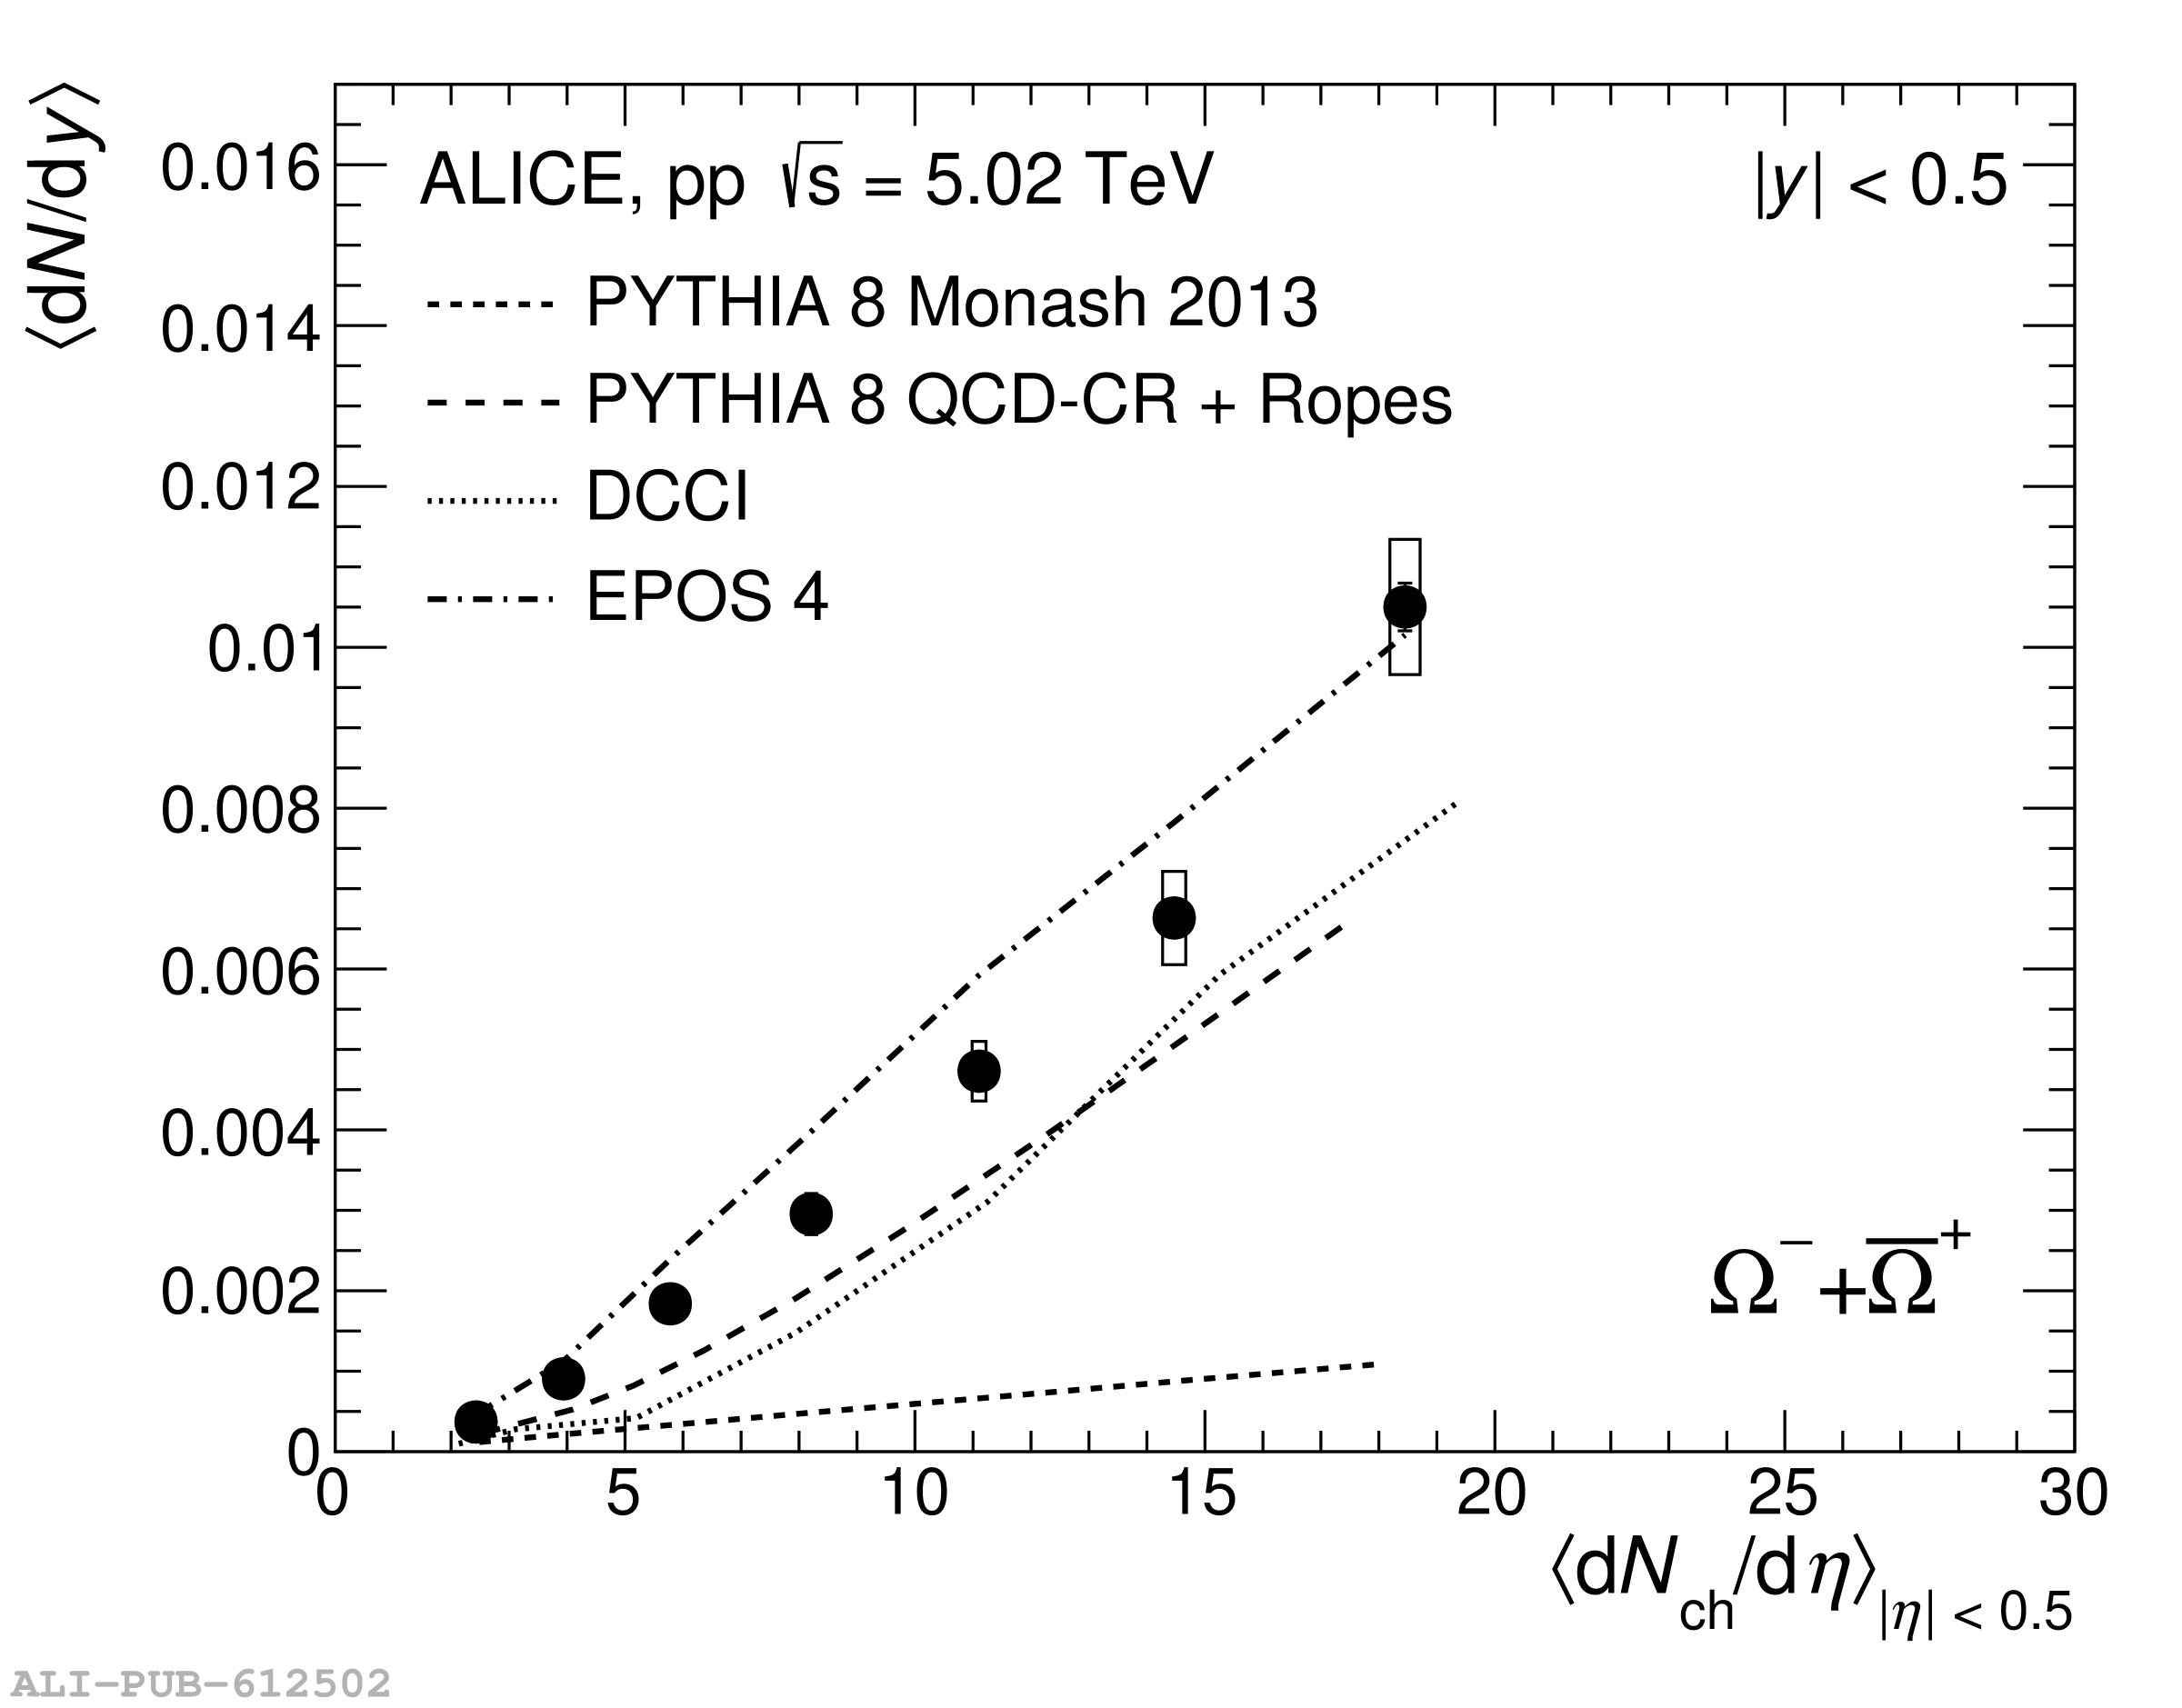 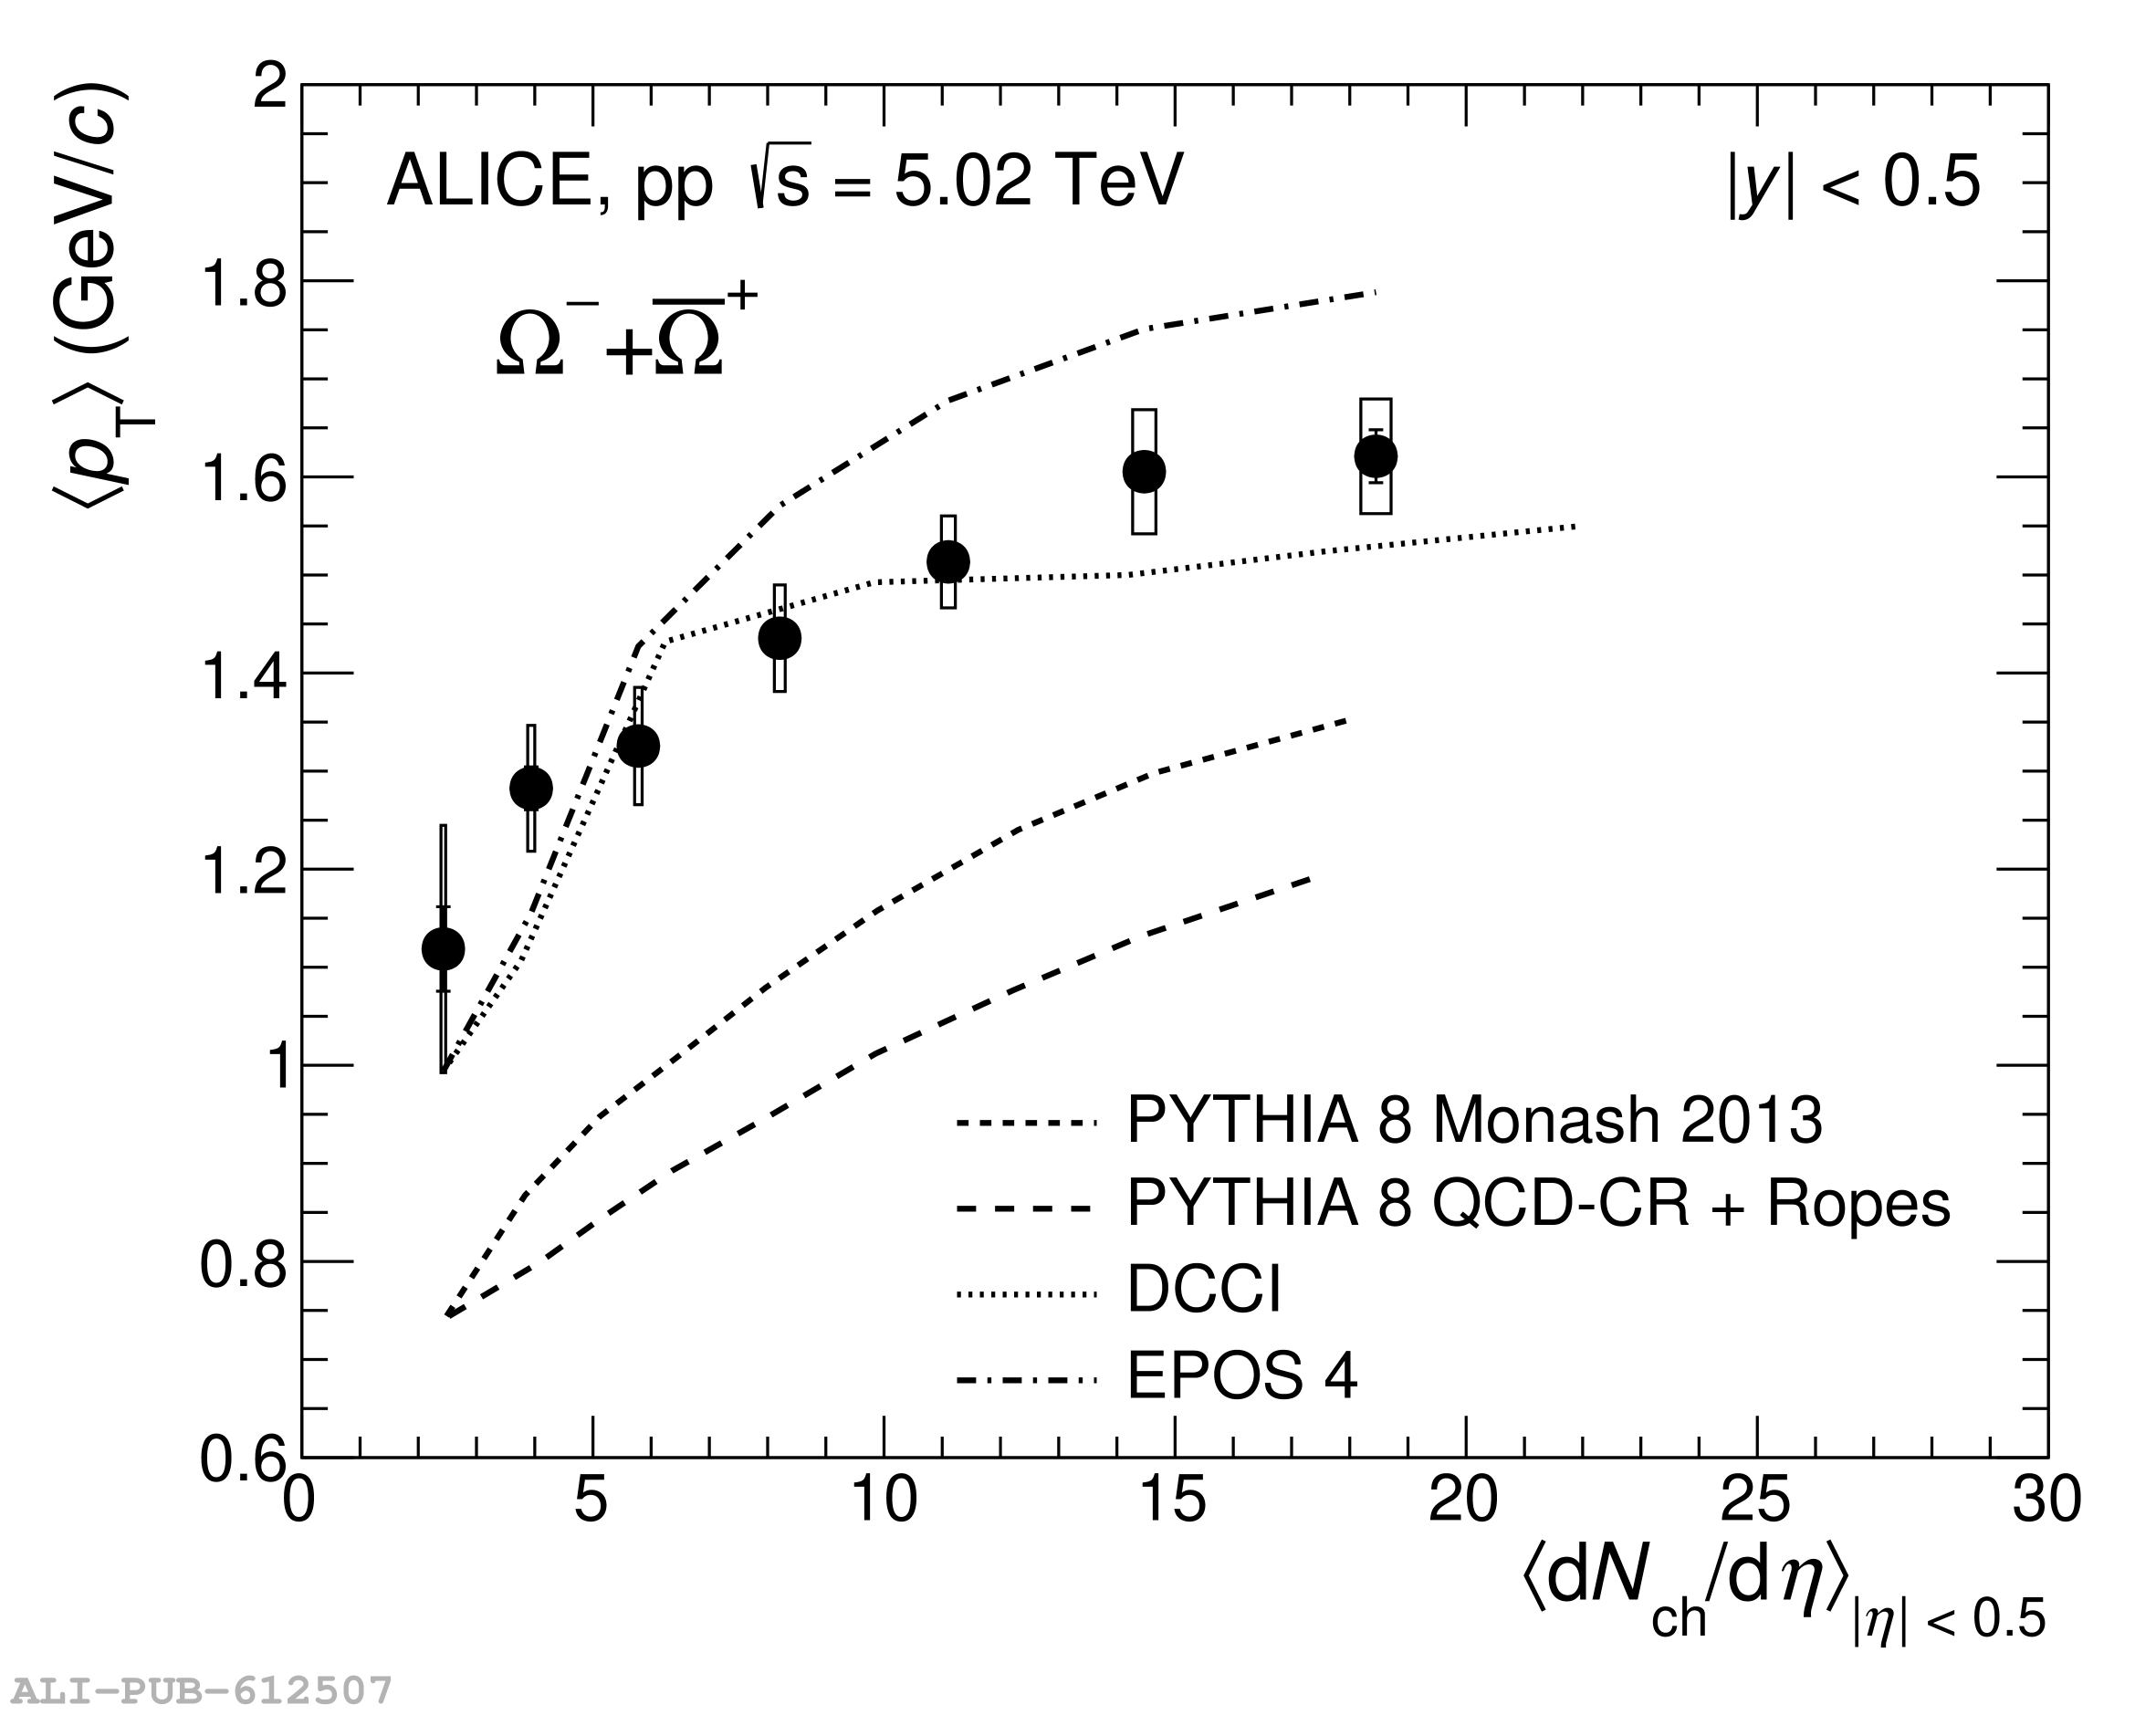 |
Figure 6
\pt distribution of \lmb/\kzero ratio in the \inelgz event class (center) and low and high-multiplicity classes (left and right panels, respectively) from pp collisions at \five. Data are compared to PYTHIA 8 Monash 2013 (dashed lines), PYTHIA 8 QCD-QR+Ropes (long-dashed lines), DCCI (dotted lines) and EPOS 4 (dash-dotted lines) MC generators. | 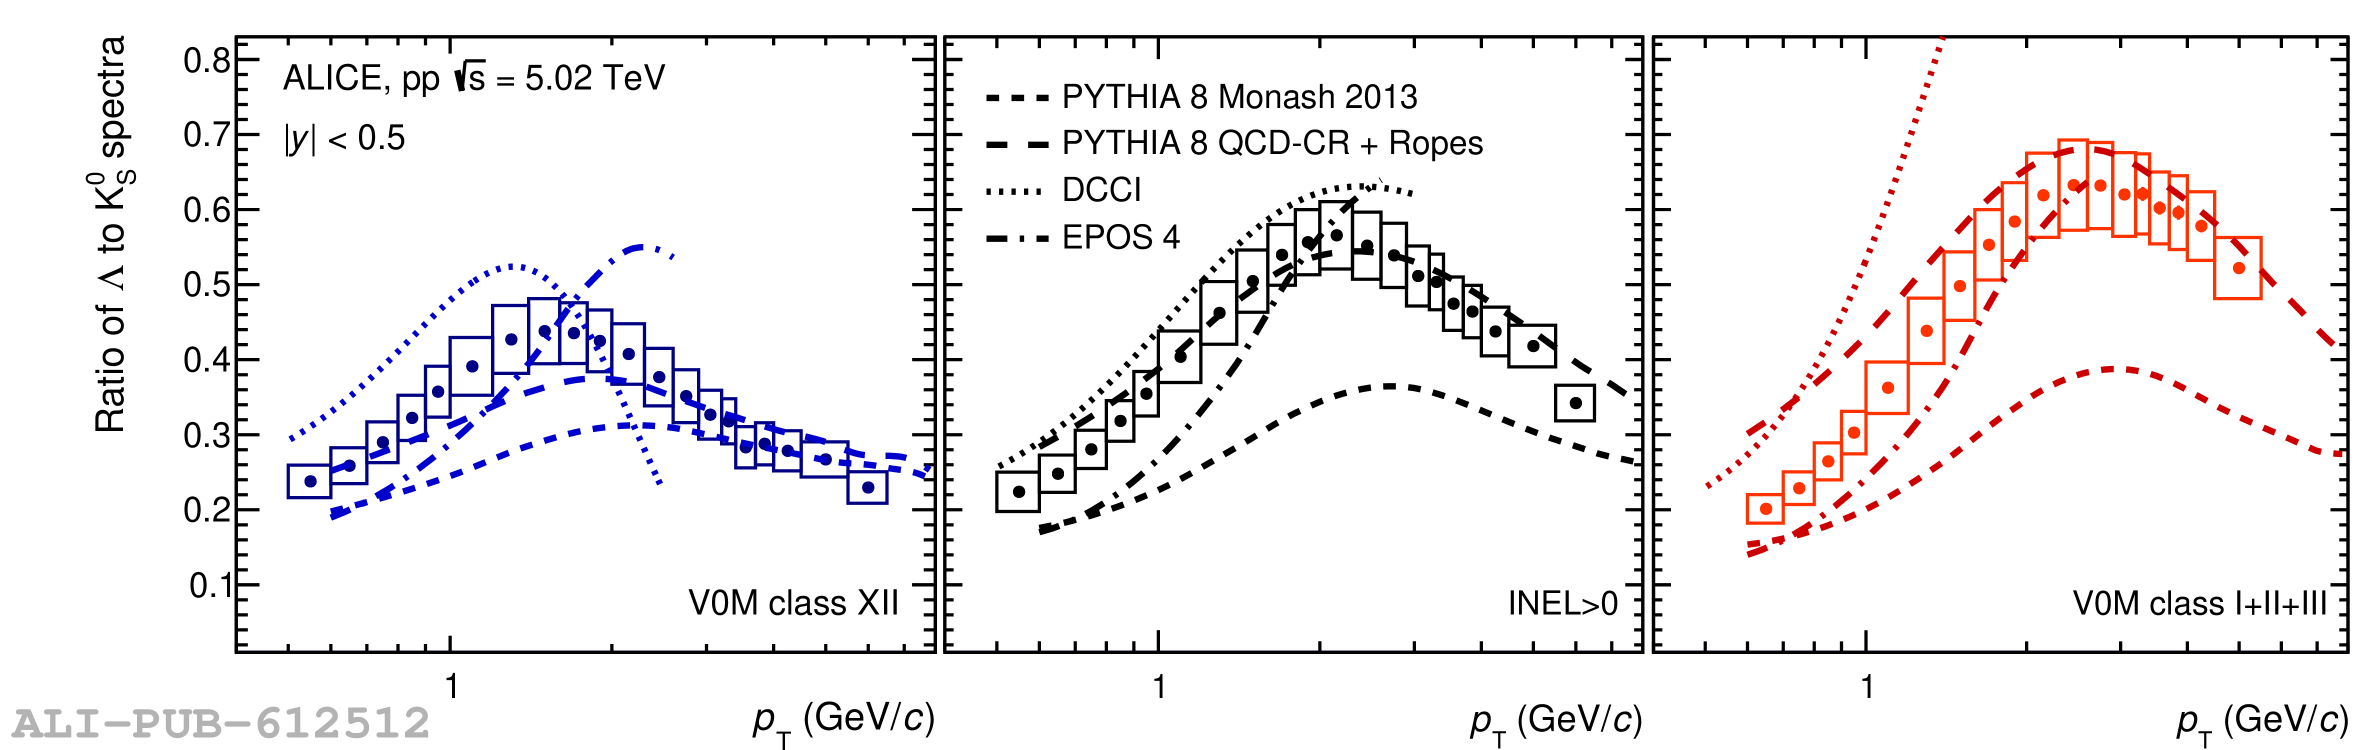 |