Expected longitudinal widths for the most central collisions of the two-particle transverse momentum correlation $G_{2}^{\rm{CI}}$ for different values of $\eta/s$ by using the expression suggested in . Data point error bars represent total uncertainties obtained by adding in quadrature statistical and systematic uncertainties. In the formula $\sigma_{\rm c}$ is the longitudinal width for the most central collisions inferred by using this expression and represented for each of the $\etas$ values by the color discontinuous bands (continuous for $\eta/s=1/4\pi$) at the highest number of participants, $\sigma_{0}$ is the longitudinal width for the most peripheral collisions (only two participants) which is obtained by extrapolating the fit, $T_{\rm c}$ is the critical temperature, $\tau_{0}$ is the formation time and $\tau_{\rm c,f}$ the freeze-out time. Error caps in the same color as the discontinuous bands, represent uncertainties of the inferred longitudinal widths for the most central collisions (see text for details). | 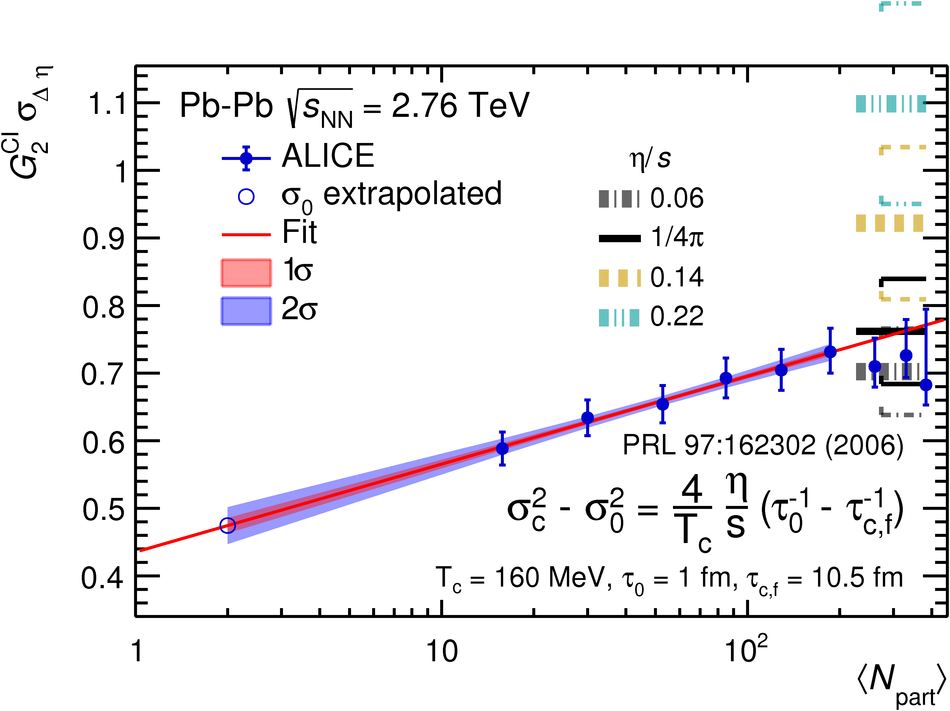 |