Two-particle transverse momentum correlations $G_{2}^{\rm CI}$ (top) and their longitudinal (middle) and azimuthal (bottom) projections for the most central (left), semi-central (center) and peripheral (right) \PbPb\ collisions at $\sqrt{s_{\rm NN}}=2.76\;\text{\TeVe}$. Vertical bars (mostly smaller than the marker size) and shaded blue bands represent statistical and systematic uncertainties, respectively. The systematic uncertainty on the long-range mean correlator strength is quoted as $\delta B$ in both projections. Under-corrected correlator values at $\Delta\eta,\Delta\varphi=0$ are not shown. See text for details. | 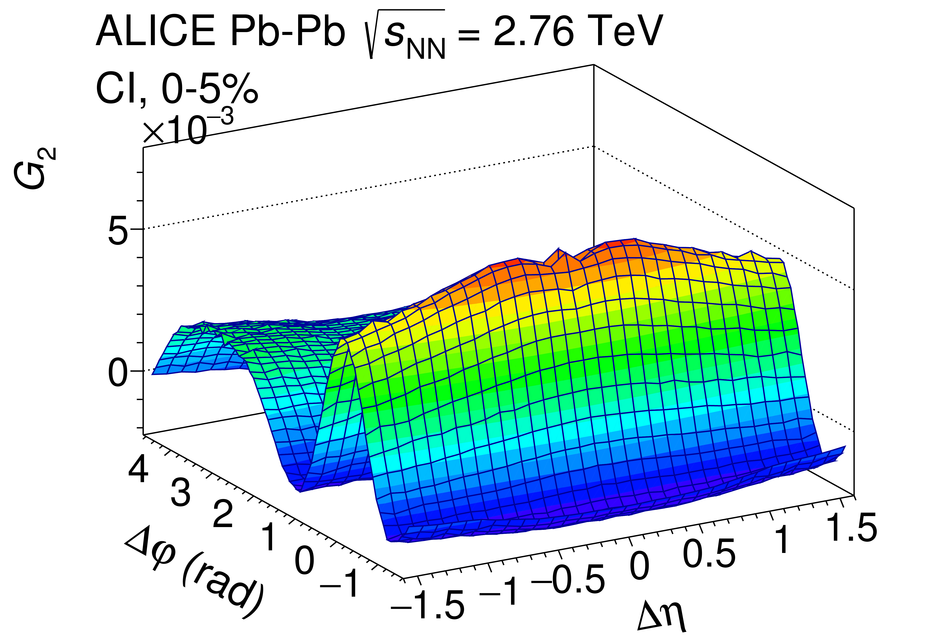  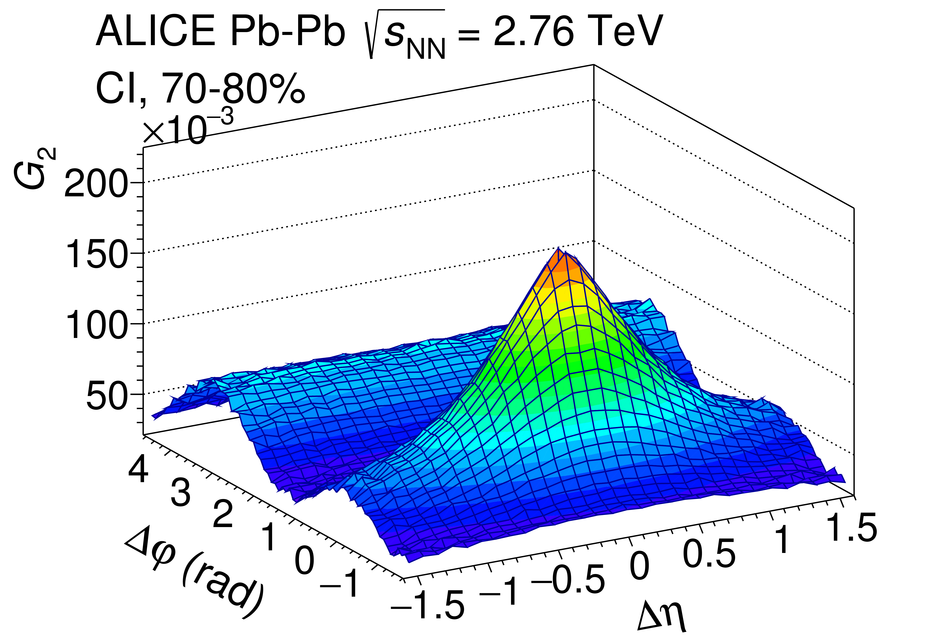 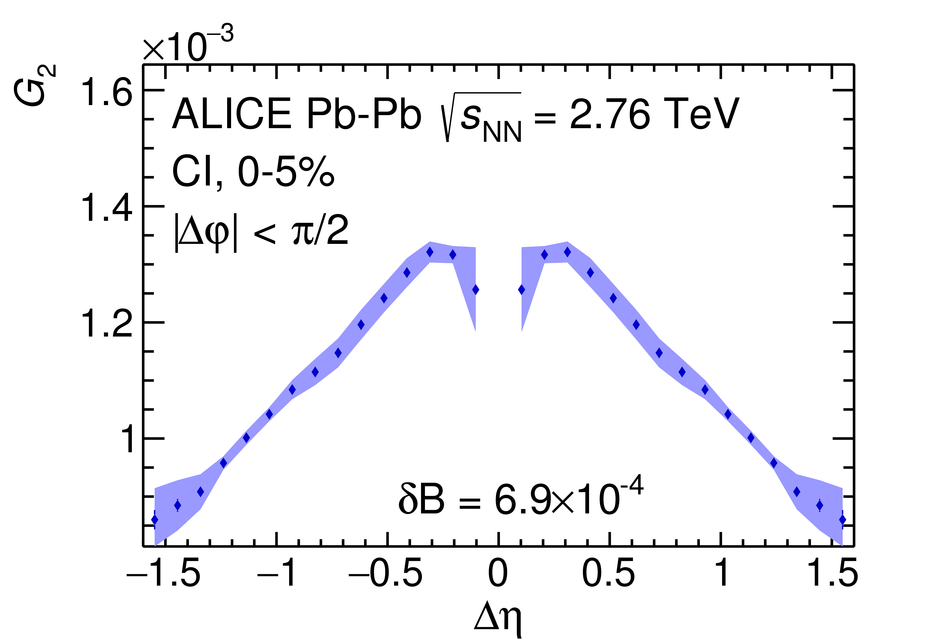 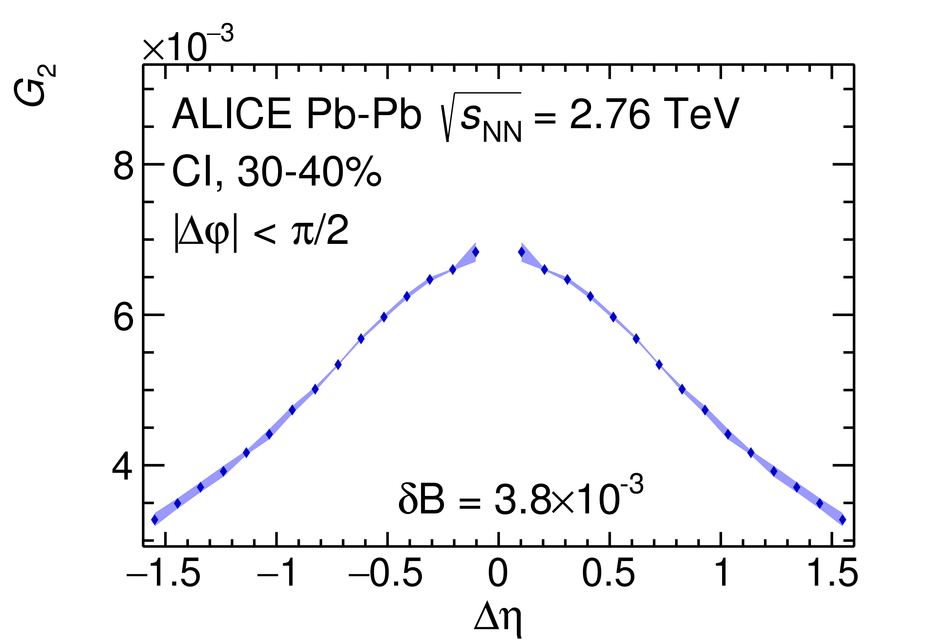 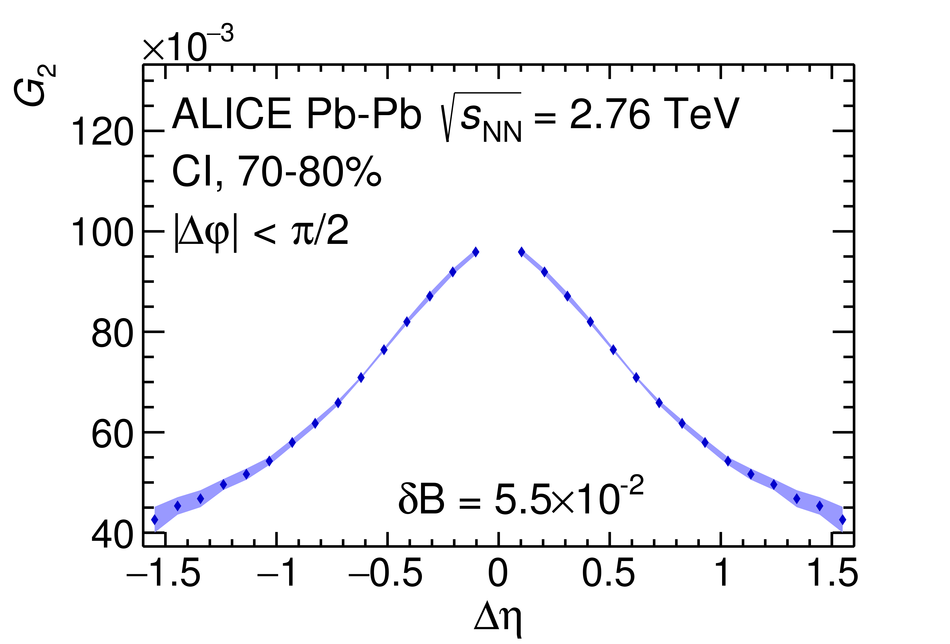 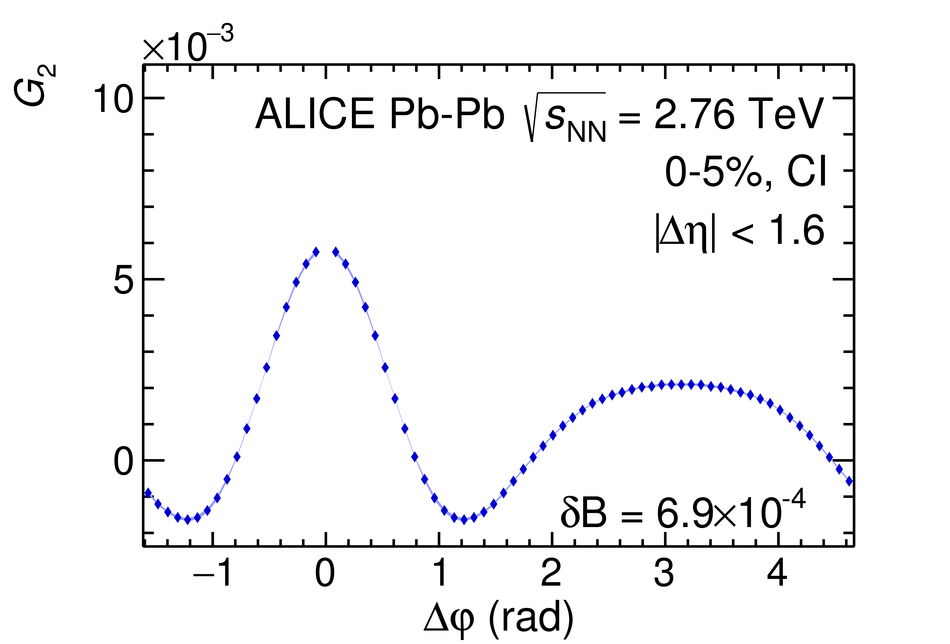  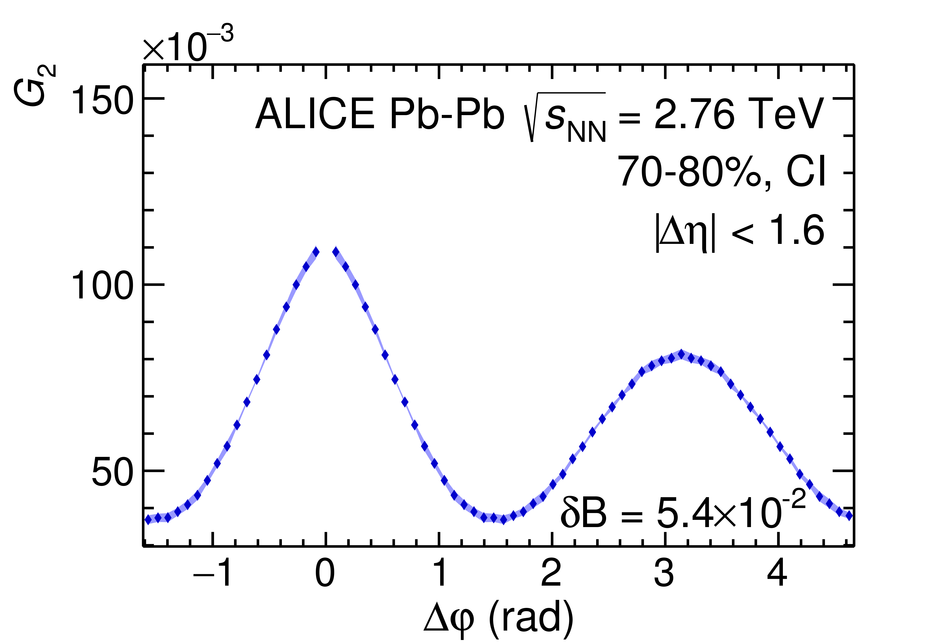 |