Left: Exemplary fits to the impact-parameter distributions of $\Dzero$, $\Dplus$, and $\Dstar$ candidates. The curves show the fit functions describing the prompt, feed-down, and background contributions as well as their sum, as described in the text Right: fraction of prompt $\Dzero$, $\Dplus$, and $\Dstar$ raw yield as a function of transverse momentum $\pt$ compared with the values obtained with the FONLL-based approach. The results from the data-driven method are shown as square markers with the error bars (boxes) representing the statistical (systematic) uncertainty. The central values of $\fprompt$ from the FONLL-based approach are shown as the dashed lines and the uncertainty as red boxes |  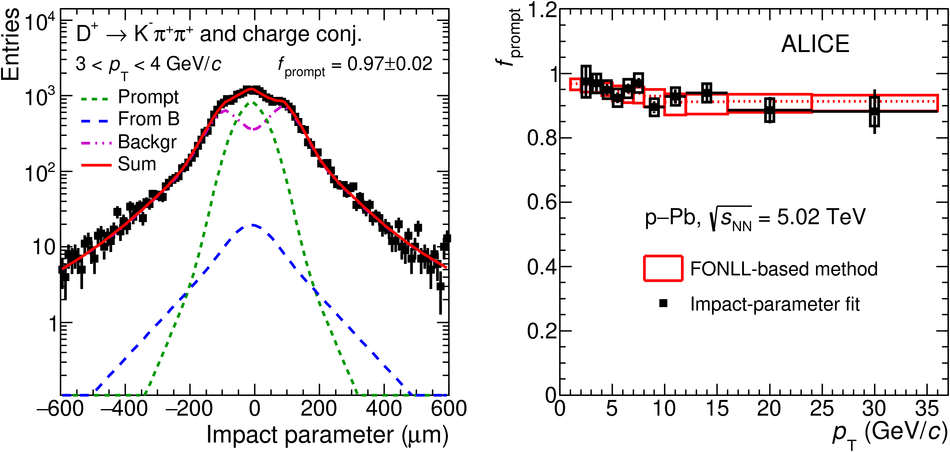 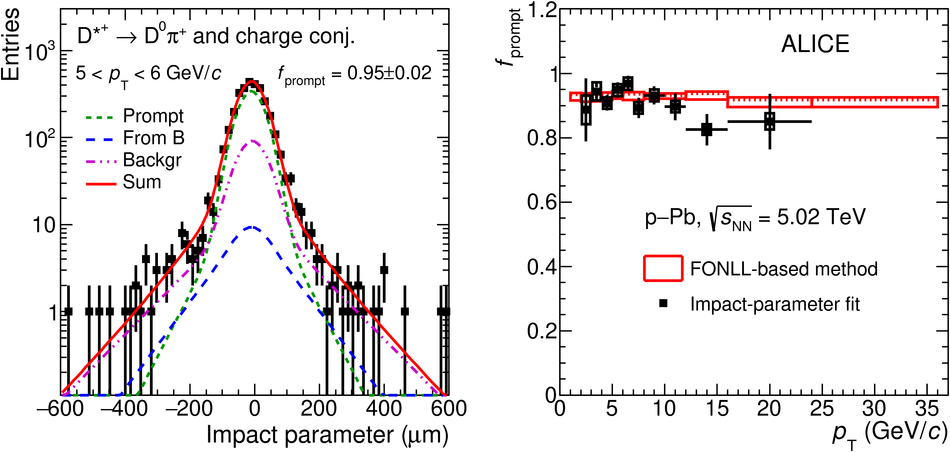 |