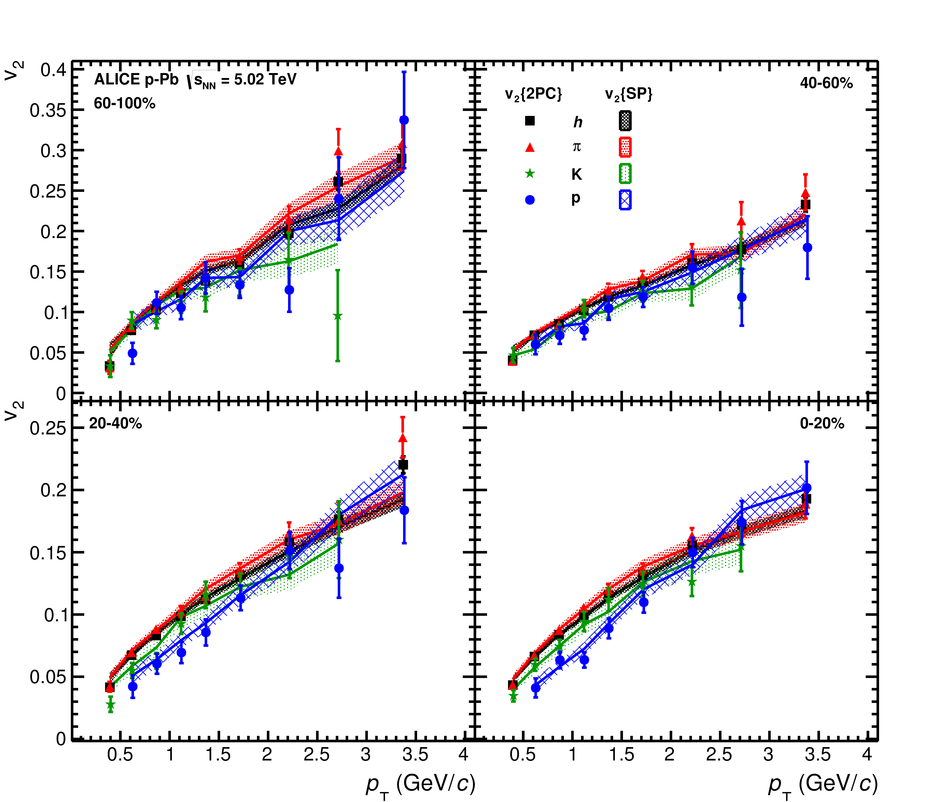
The Fourier coefficient $v_2$ for all charged particles, pions, kaons and protons as a function of $\pt$ is shown for the different multiplicity classes extracted for $v_2\{{\rm 2PC}\}$ (symbols) and $v_2\{{\rm SP}\}$ (shaded bands, with a line connecting the central values). The data is plotted at the average-$\pt$ for each considered $\pt$ interval and particle species under study. Error bars and widths of the bands show statistical uncertainties and systematic uncertainties, essentially uncorrelated in $\pt$, added in quadrature. |  |