Transverse-momentum spectra of deuterons (left) and anti-deuterons (right) measured at mid-rapidity in pp collisions at \sqrtSE{7} in the considered multiplicity classes. The vertical bars are the statistical uncertainties, the open boxes represent the systematic ones. The dashed lines correspond to individual fits to the data performed with the L\'evy-Tsallis function (see Eq. \ref{eq:levy}). The spectra have been scaled with the indicated factors for better visibility. | 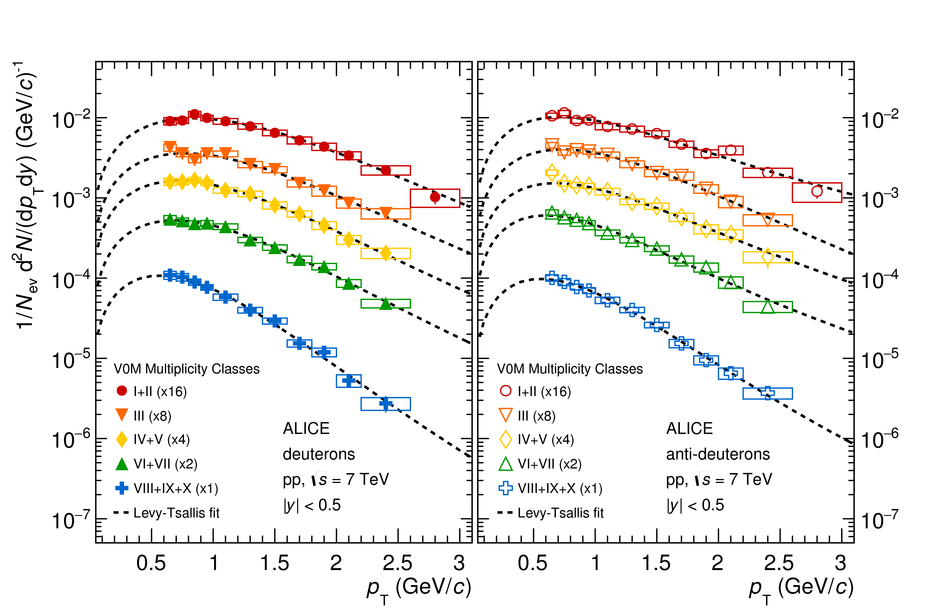 |