TOF squared-mass distribution ($m_{\rm TOF}^2$) around the anti-deuteron peak for a selected \pt interval and in the highest multiplicity class The solid red line represents a fit of a Gaussian function plus an exponential right tail to the anti-deuteron signal, the grey dashed line the fit of the background performed using the sum of two exponential functions, and the solid blue line is the sum of the signal and background components. | 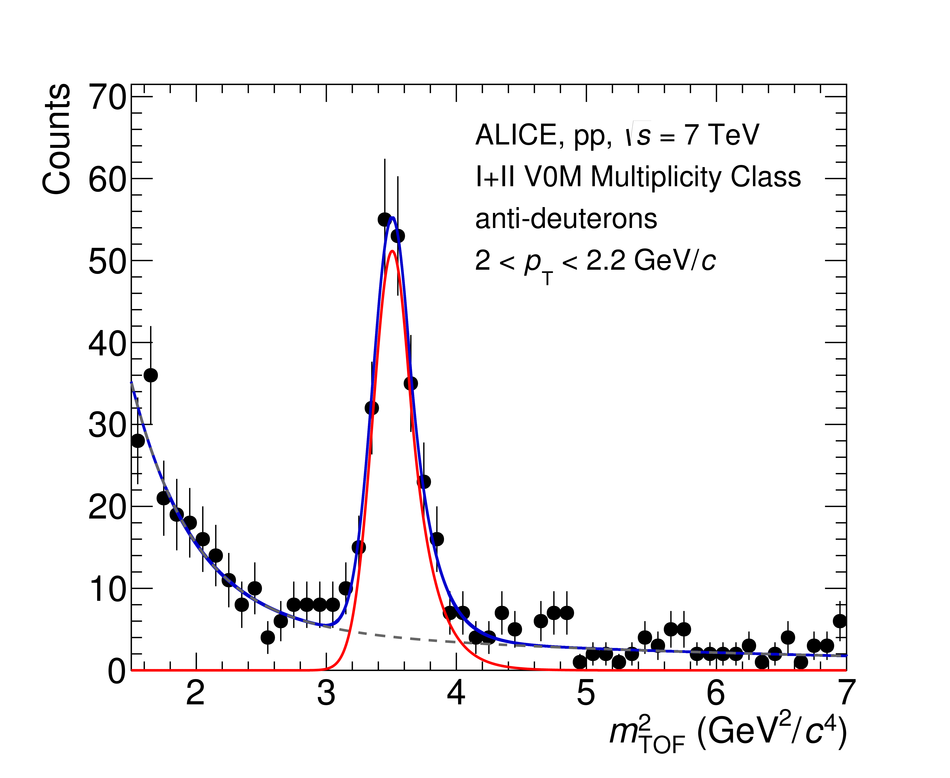 |