Inclusive $\psi$(2S) production is measured in p-Pb collisions at the centre-of-mass energy per nucleon-nucleon pair $\sqrt{s_{\rm{NN}}}=8.16$ TeV, using the ALICE detector at the CERN LHC. The production of $\psi$(2S) is studied at forward ($2.03 <~ y_{\rm cms} <~ 3.53$) and backward ($-4.46 <~ y_{\rm cms} <~ -2.96$) centre-of-mass rapidity and for transverse momentum $p_{\rm{T}}$ $<~$ 12 GeV/$c$ via the decay to muon pairs. In this paper, we report the integrated as well as the $y_{\rm cms}$- and $p_{\rm T}$-differential inclusive production cross sections. Nuclear effects on $\psi$(2S) production are studied via the determination of the nuclear modification factor that shows a strong suppression at both forward and backward centre-of-mass rapidities. Comparisons with corresponding results for inclusive J/$\psi$ show a similar suppression for the two states at forward rapidity (p-going direction), but a stronger suppression for $\psi$(2S) at backward rapidity (Pb-going direction). As a function of $p_{\rm T}$, no clear dependence of the nuclear modification factor is found. The relative size of nuclear effects on $\psi$(2S) production compared to J/$\psi$ is also studied via the double ratio of production cross sections $[\sigma_{\psi(2S)}/\sigma_{\rm{J/}\psi}]_{\rm pPb}/[\sigma_{\psi(2S)}/\sigma_{\rm{J/}\psi}]_{\rm pp}$ between p-Pb and pp collisions. The results are compared with theoretical models that include various effects related to the initial and final state of the collision system and also with previous measurements at $\sqrt{s_{\rm{NN}}}$ = 5.02 TeV.
JHEP07 (2020) 237
HEP Data
e-Print: arXiv:2003.06053 | PDF | inSPIRE
CERN-EP-2020-036
Figure 1
Fit examples of the $p_{\mathrm{T}}$ and $y$ integrated mass spectrum for the forward (left) and backward (right) rapidity data samples. The contribution of the resonances and of the background are also shown separately. These fits are performed using the CB2 as signal function and the VWG background shape. | 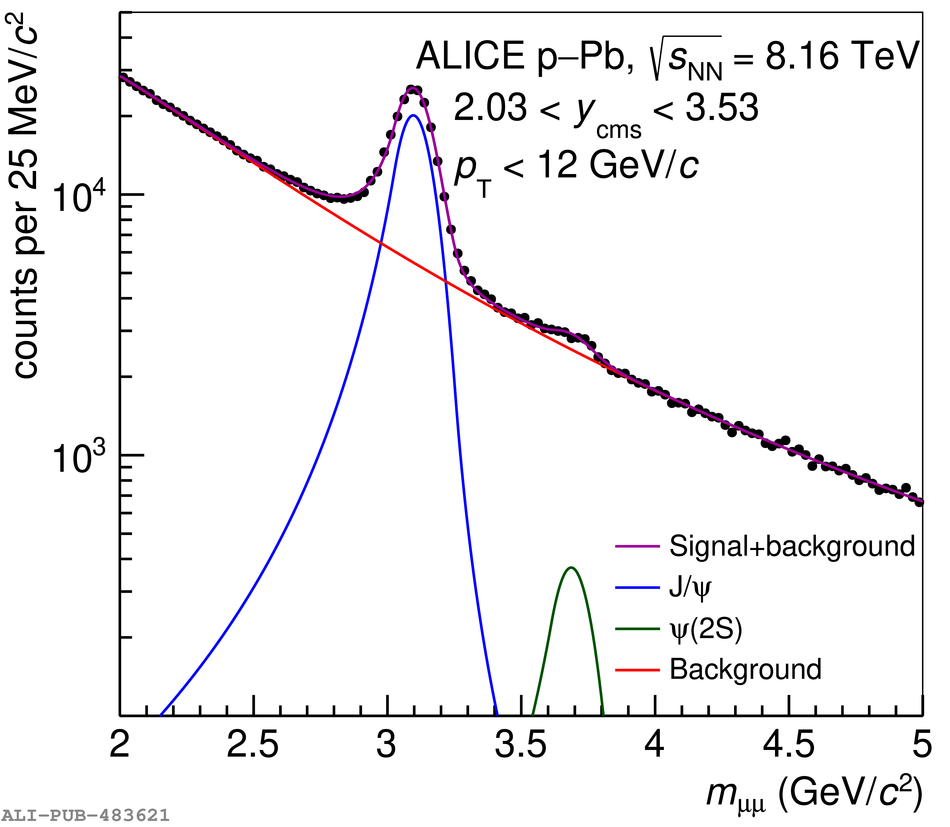 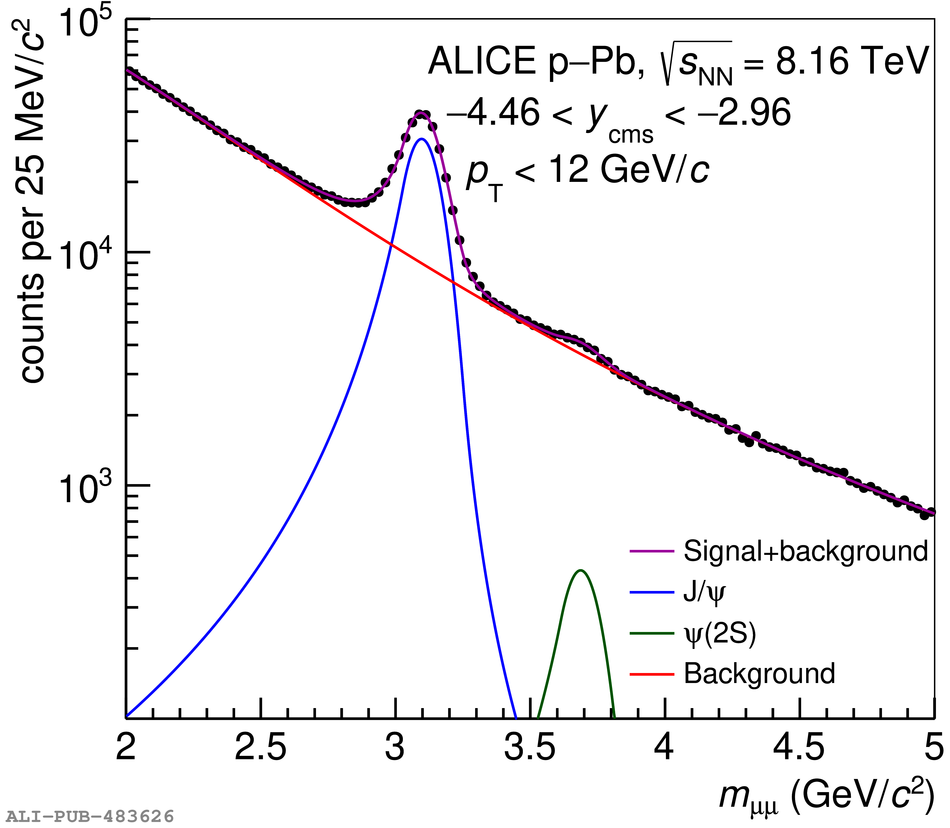 |

Figure 3
The differential cross sections ${\rm B.R.}_{\psi(2{\rm S})\rightarrow\mu^+\mu^-}{\rm d}^2\sigma^{\psi(2{\rm S})}/{\rm d}y{\rm d}p_{\rm T}$ for \ppb collisions at $\sqrtSnn = 8.16$ TeV, shown separately for the forward and backward $y_{\rm cms}$ samples. The error bars represent the statistical uncertainties, while the boxes correspond to total systematic uncertainties. The latter are uncorrelated among the points, except for a very small correlated uncertainty (0.5\% and 0.7\% for the forward and backward $y_{\rm cms}$ samples, respectively). The grey bands correspond to the reference pp cross section scaled by A$_{\rm Pb}$. | 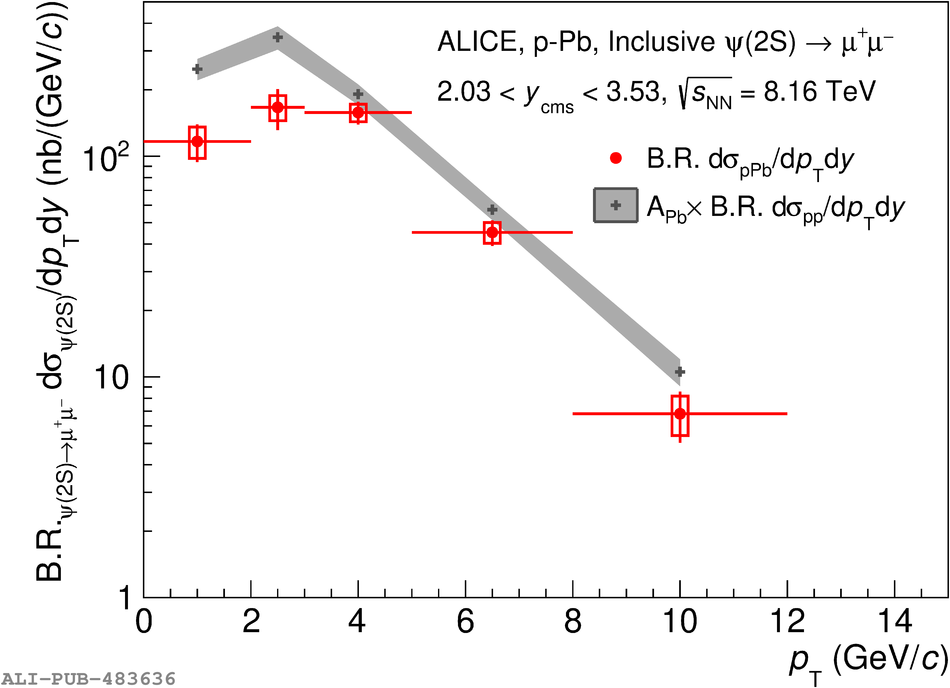 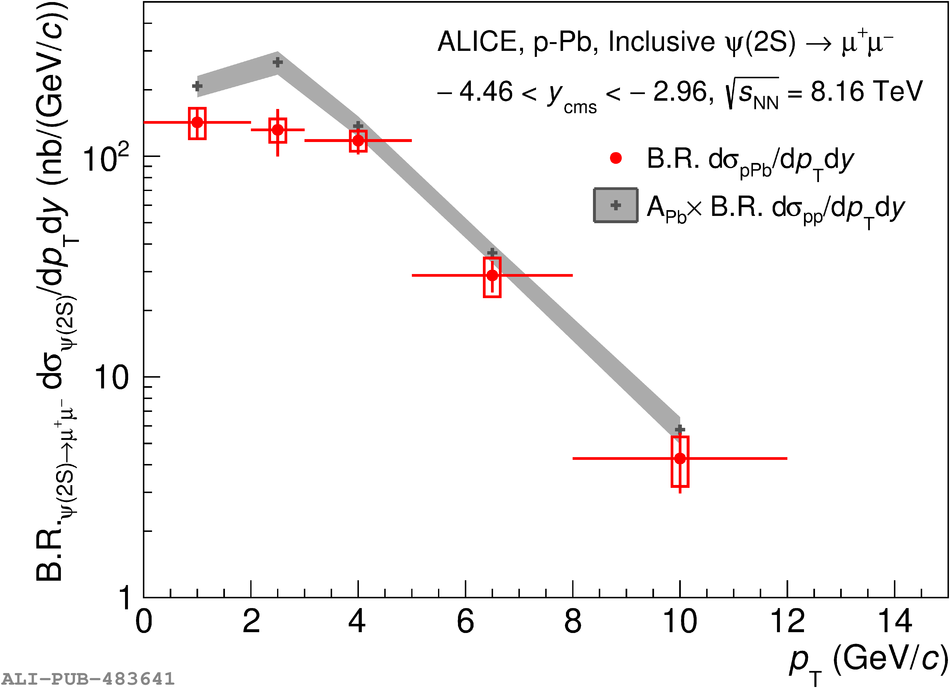 |
Figure 4
The ratio ${\rm B.R.}_{\psi(2{\rm S})\rightarrow\mu^+\mu^-}\sigma^{\psi(2{\rm S})}/{\rm B.R.}_{{\rm J}/\psi\rightarrow\mu^+\mu^-}\sigma^{{\rm J}/\psi}$ as a function of $y_{\rm cms}$ for \ppb collisions at $\sqrtSnn = 8.16$ TeV, compared with the corresponding pp quantity, shown as a grey band and obtained via an interpolation of results at $\sqrt{s}=$ 5, 7, 8 and 13 TeV . The error bars represent the statistical uncertainties, while the boxes correspond to uncorrelated systematic uncertainties. The published \ppb results at $\sqrtSnn = 5.02$ TeV are also shown. | 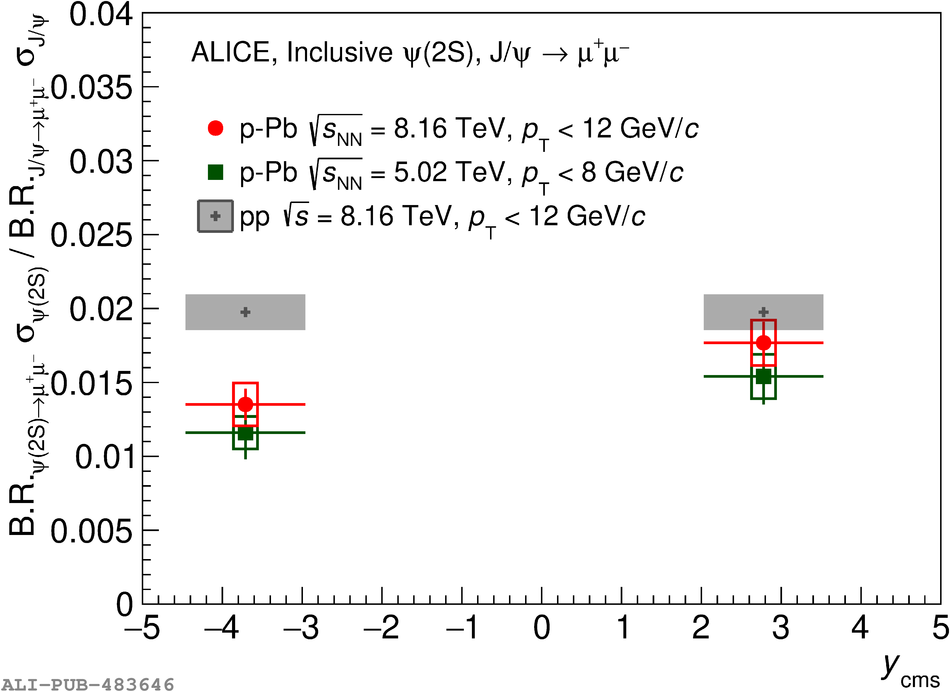 |
Figure 5
The ratio ${\rm B.R.}_{\psi(2{\rm S})\rightarrow\mu^+\mu^-}\sigma^{\psi(2{\rm S})}/{\rm B.R.}_{{\rm J}/\psi\rightarrow\mu^+\mu^-}\sigma^{{\rm J}/\psi}$ as a function of \pt, for \ppb collisions at $\sqrtSnn = 8.16$ TeV, compared with the corresponding pp quantity, shown as a grey band and obtained via an interpolation of results at $\sqrt{s}=$ 7, 8 and 13 TeV . The error bars represent the statistical uncertainties, while the boxes correspond to uncorrelated systematic uncertainties. | 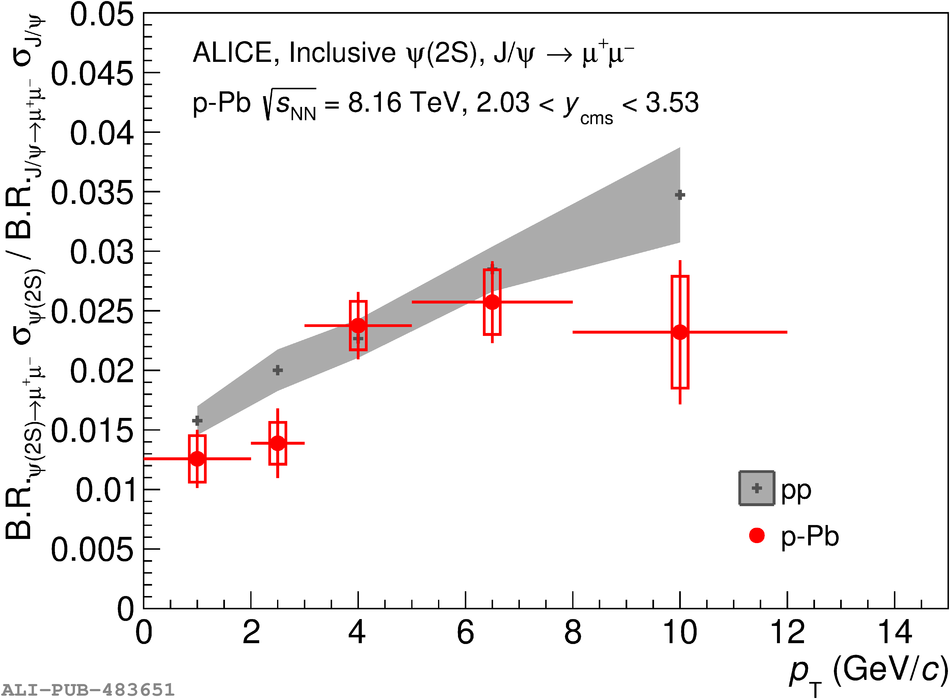 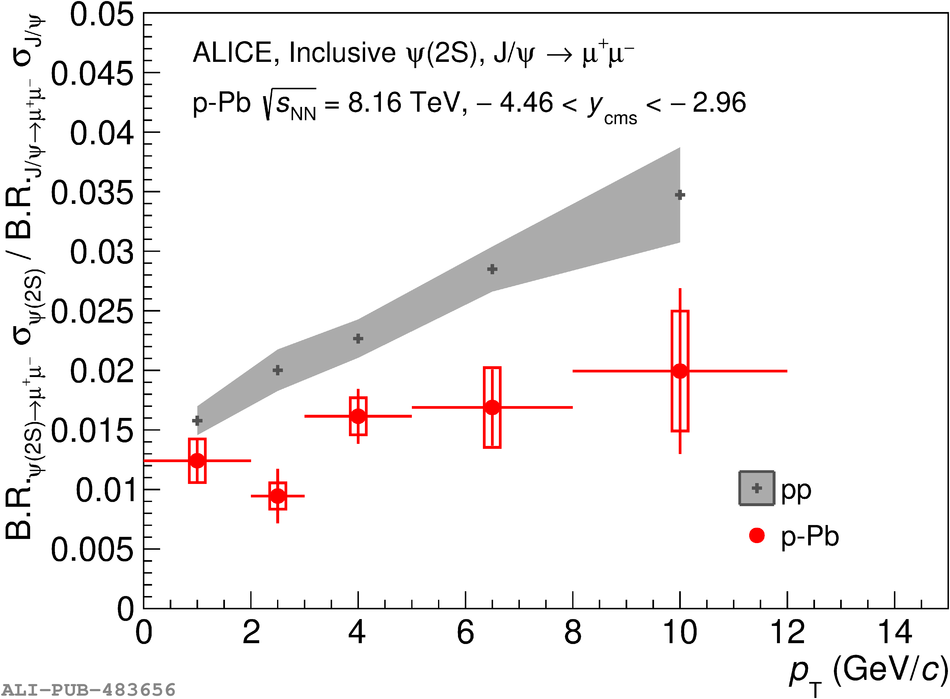 |
Figure 6
The $y_{\rm cms}$-dependence of $R_{\rm{pPb}}$ for \psip and \jpsi in p--Pb collisions at $\sqrtSnn = 8.16$ TeV. The error bars represent the statistical uncertainties, while the boxes correspond to uncorrelated systematic uncertainties and the box at $R_{\rm pPb}=1$ to correlated systematic uncertainties. The results are compared with models including initial-state effects and coherent energy loss (left panel), and to models which also implement final-state effects (right panel). |  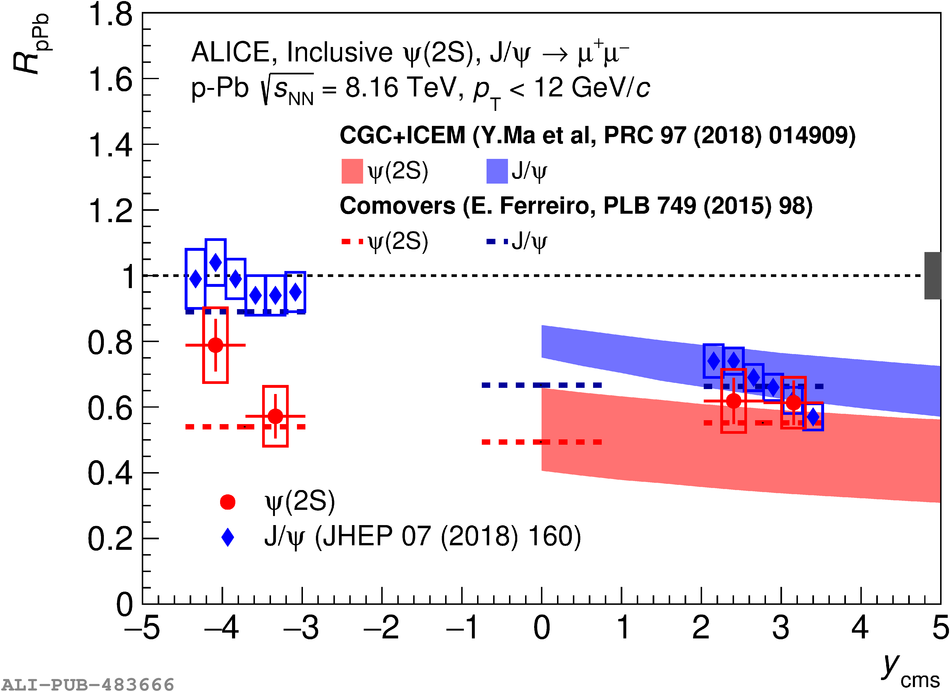 |
Figure 7
The $p_{\rm T}$-dependence of $R_{\rm{pPb}}$ for \psip and \jpsi at forward (left) and backward (right) rapidity in \ppb collisions, at $\sqrtSnn = 8.16$ TeV. The error bars represent the statistical uncertainties, while the boxes correspond to uncorrelated systematic uncertainties and the box at $R_{\rm pPb}=1$ to correlated systematic uncertainties. The comparison with the results of a CGC-based model , which implements final-state effects, is also shown. | 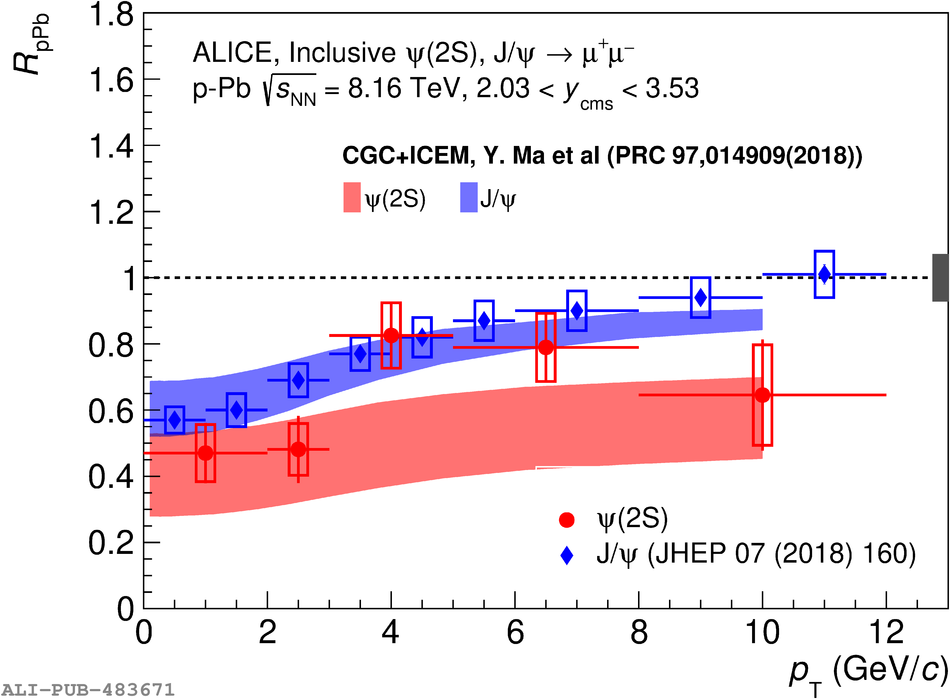 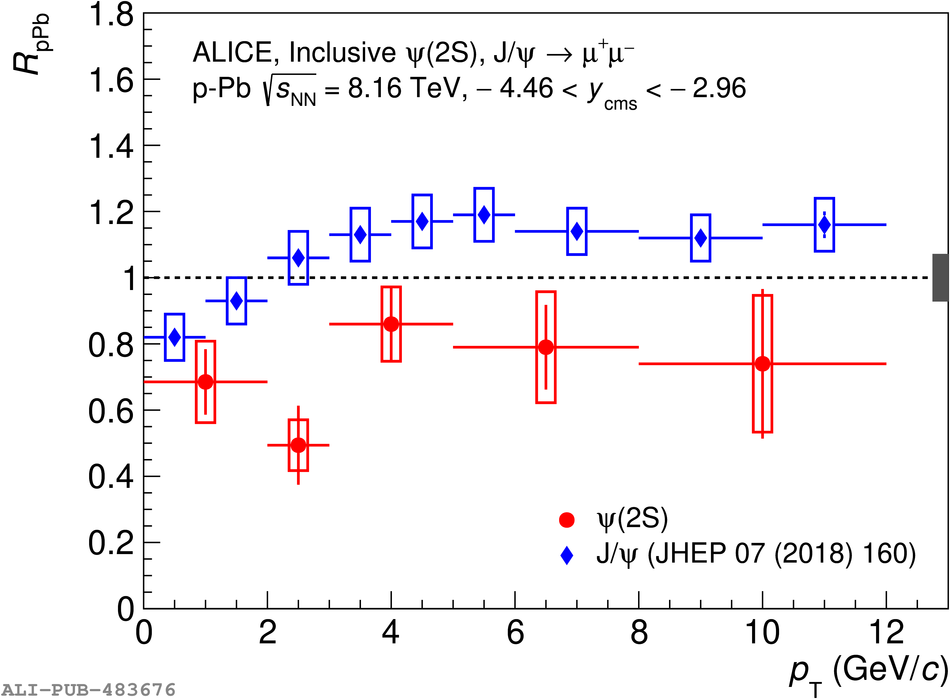 |
Figure 8
Comparison of the rapidity dependence of $R_{\rm{pPb}}$ for \psip in p--Pb collisions at $\sqrtSnn = 8.16$ and 5.02 TeV . The error bars represent the statistical uncertainties, while the boxes correspond to uncorrelated systematic uncertainties and the boxes at $R_{\rm pPb}=1$ to correlated systematic uncertainties, separately shown for the two energies. The results are also compared with theoretical models that include final-state effects . |  |
Figure 9
Comparison of the transverse-momentum dependence of $R_{\rm{pPb}}$ for \psip in p--Pb collisions at $\sqrtSnn = 8.16$ and 5.02 TeV . The error bars represent the statistical uncertainties, while the boxes correspond to uncorrelated systematic uncertainties and the boxes at $R_{\rm pPb}=1$ to correlated systematic uncertainties, separately shown for the two energies. | 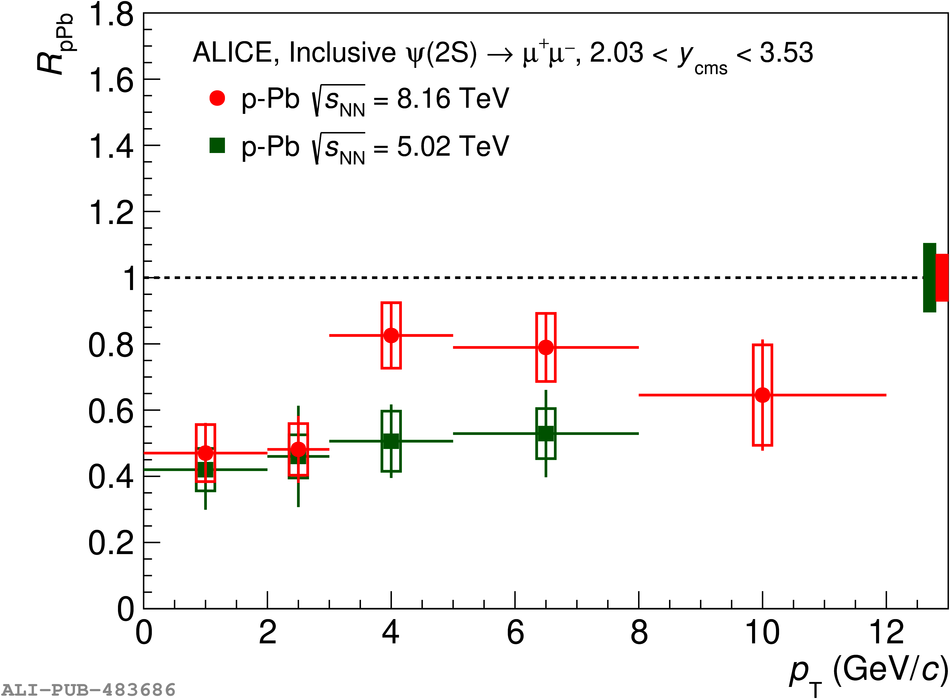 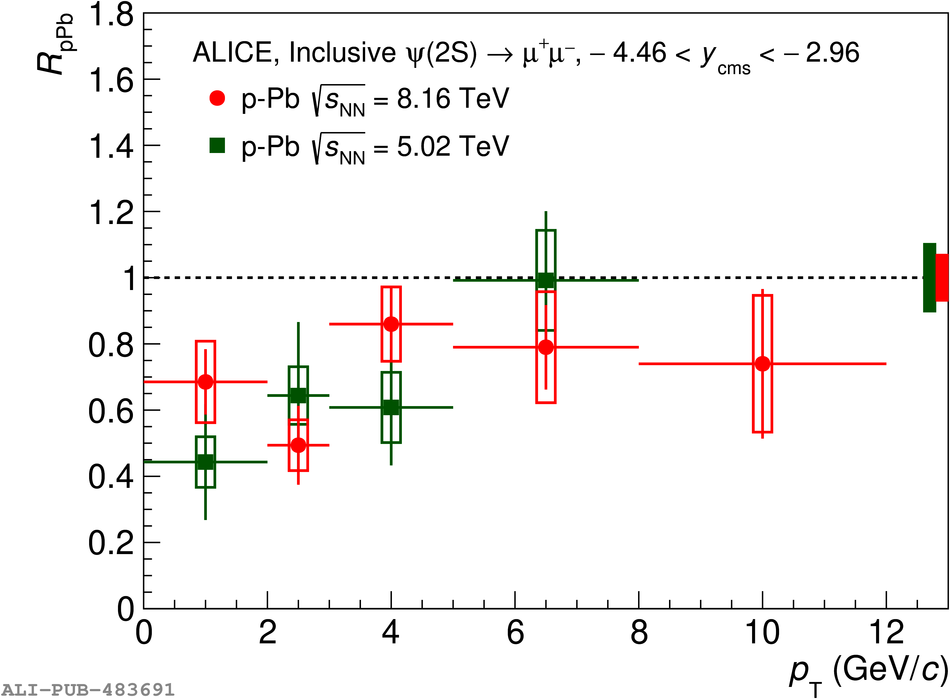 |
Figure 10
Double ratio of $\psip$ and J/$\psi$ cross sections in \ppb and pp collisions as a function of rapidity, at $\sqrtSnn = 8.16$ TeV, compared with the corresponding results at $\sqrtSnn = 5.02$ TeV . The error bars represent the statistical uncertainties, while the boxes correspond to uncorrelated systematic uncertainties. | 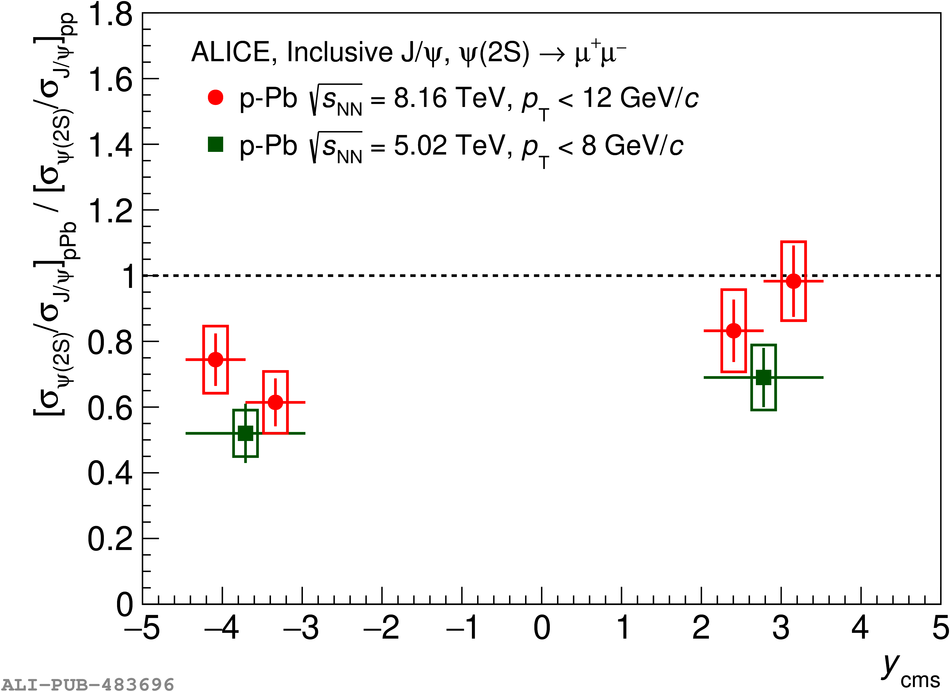 |
Figure 11
Double ratio of $\psip$ and J/$\psi$ cross sections in \ppb and pp collisions as a function of transverse momentum, at forward (left) and backward (right) rapidity at $\sqrtSnn = 8.16$ TeV, compared with the corresponding results at $\sqrtSnn = 5.02$ TeV . The error bars represent the statistical uncertainties, while the boxes correspond to uncorrelated systematic uncertainties. | 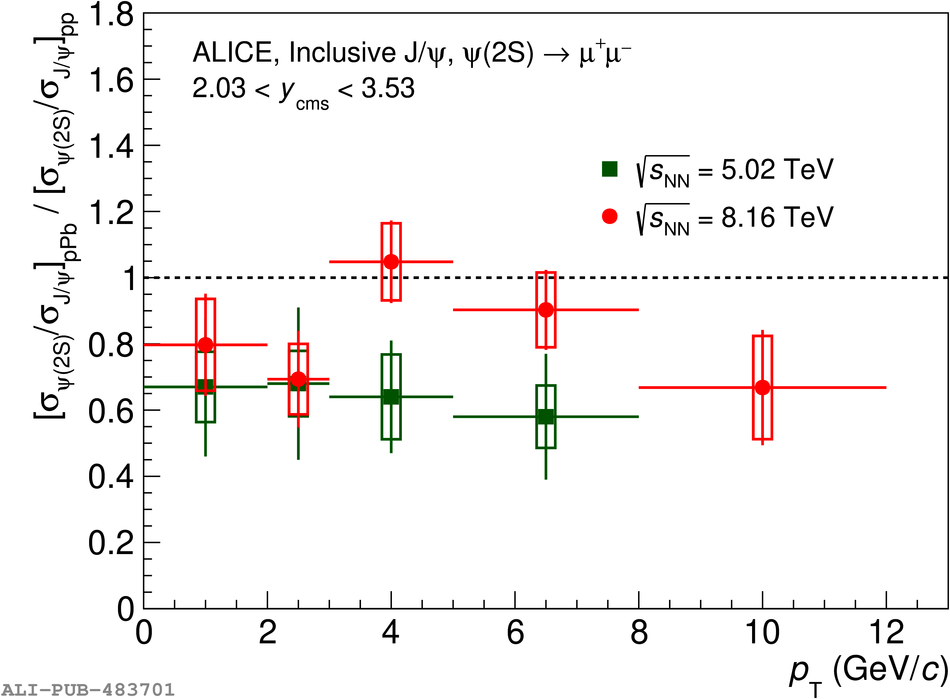 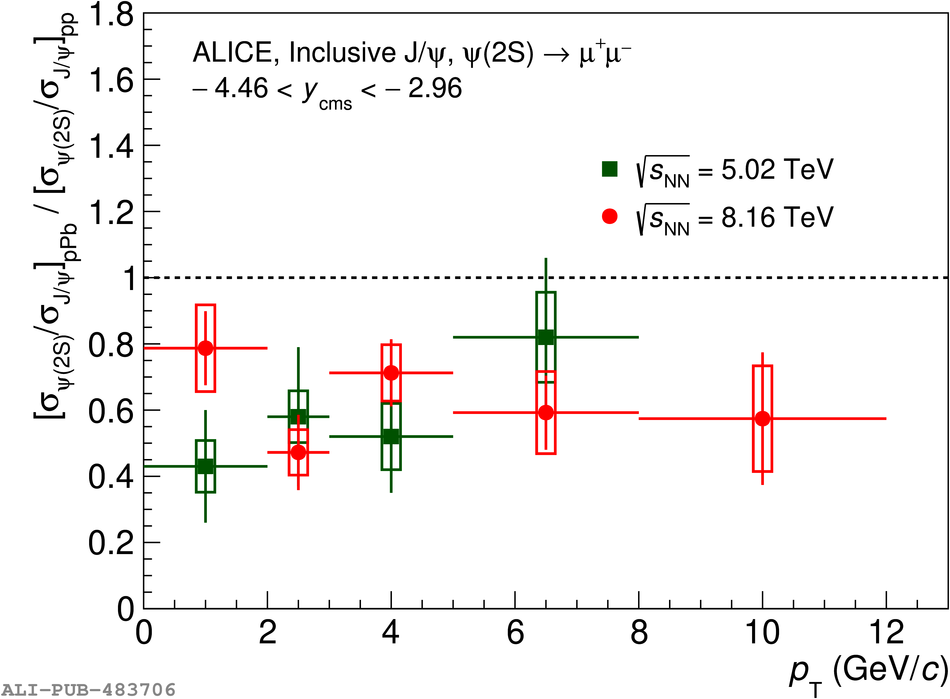 |