Comparison of the charged jet cross section to NLO MC predictions (POWHEG+PYTHIA8) with different jet resolution parameter $R=0.2$ (a), $0.3$ (b), $0.4$ (c), and $0.6$ (d). Statistical uncertainties are displayed as vertical error bars. The systematic uncertainty on the data is indicated by a shaded band drawn around unity. The red lines in the ratio correspond to unity. | 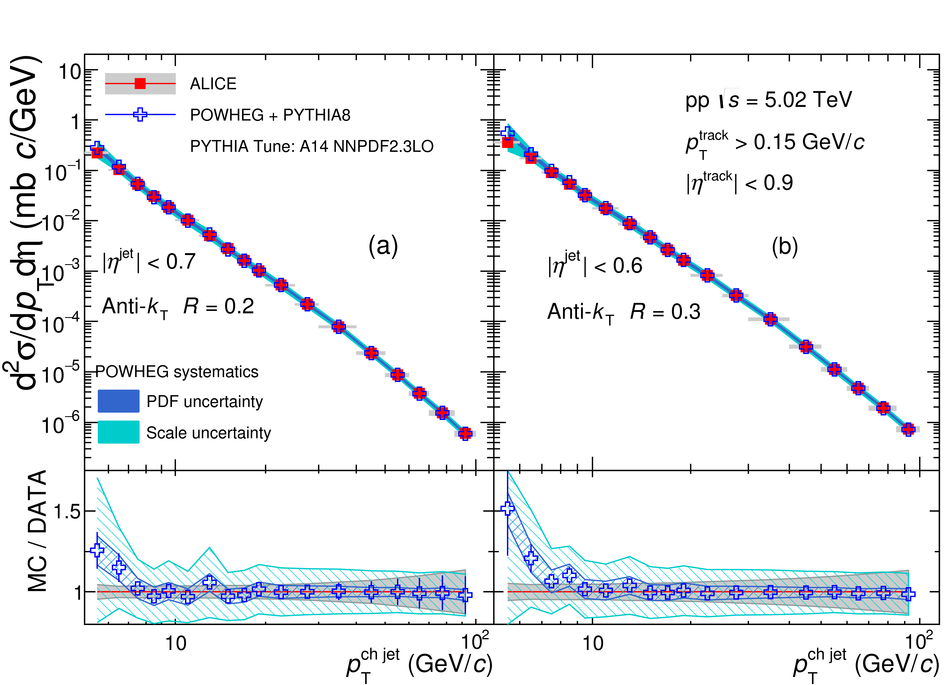 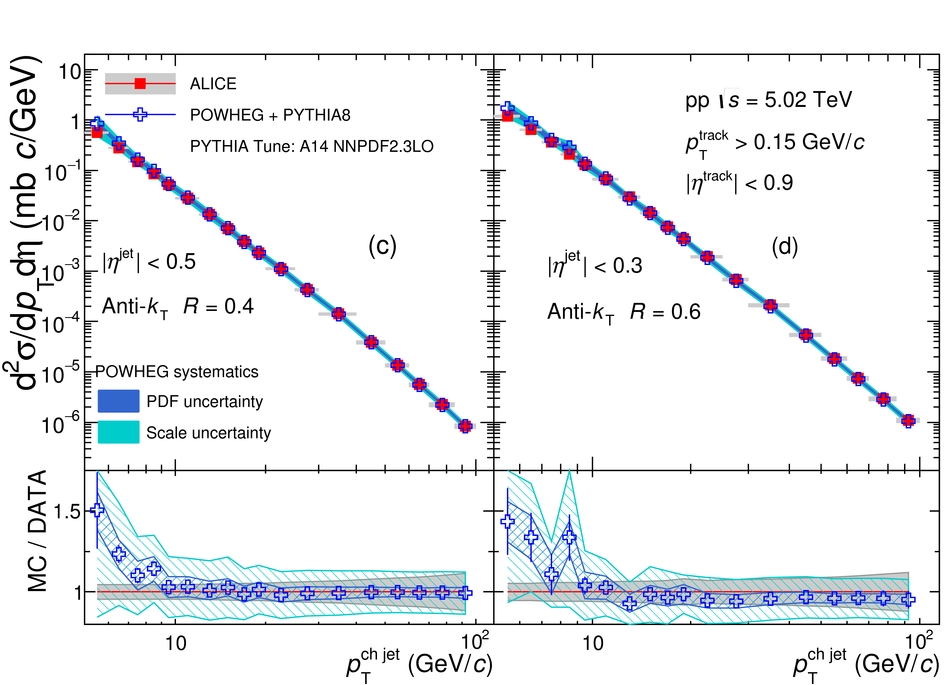 |