Jet relative radial shape distributions, differences, and ratios for the 0--10\% most central collisions for two different low-$\pT$ constituent ranges Boxes represent systematic uncertainties, shaded boxes include uncertainties from PYTHIA/pp comparison, and error bars represent statistical uncertainties. Observables are corrected for acceptance and background effects The $y$-axis scale of the ratio is chosen to focus on $r< 0.3$, where the deviation of the ratio from unity is significant | 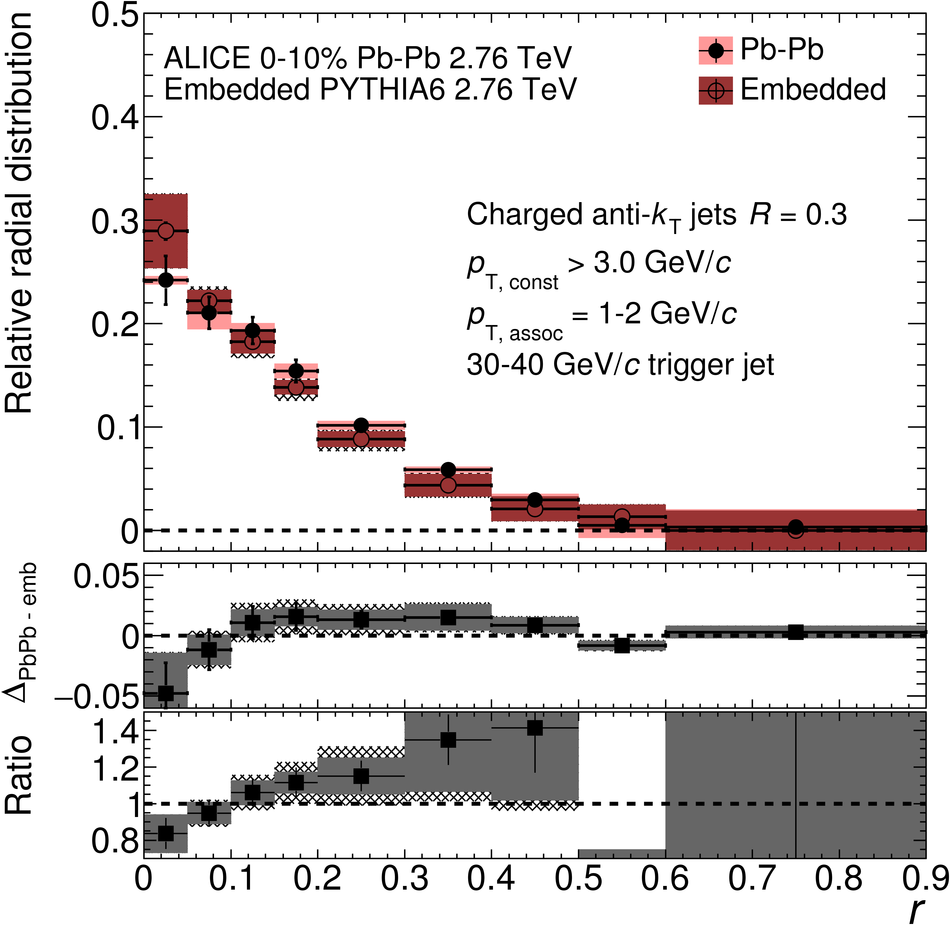  |