Jet relative radial shape distributions, differences, and ratios for the 0--10\% most central collisions for high-$\pT$ constituents, shown for different jet transverse momenta Boxes represent systematic uncertainties, shaded boxes include uncertainties from PYTHIA/pp comparison, and error bars represent statistical uncertainties. Observables are corrected for acceptance and background effects. | 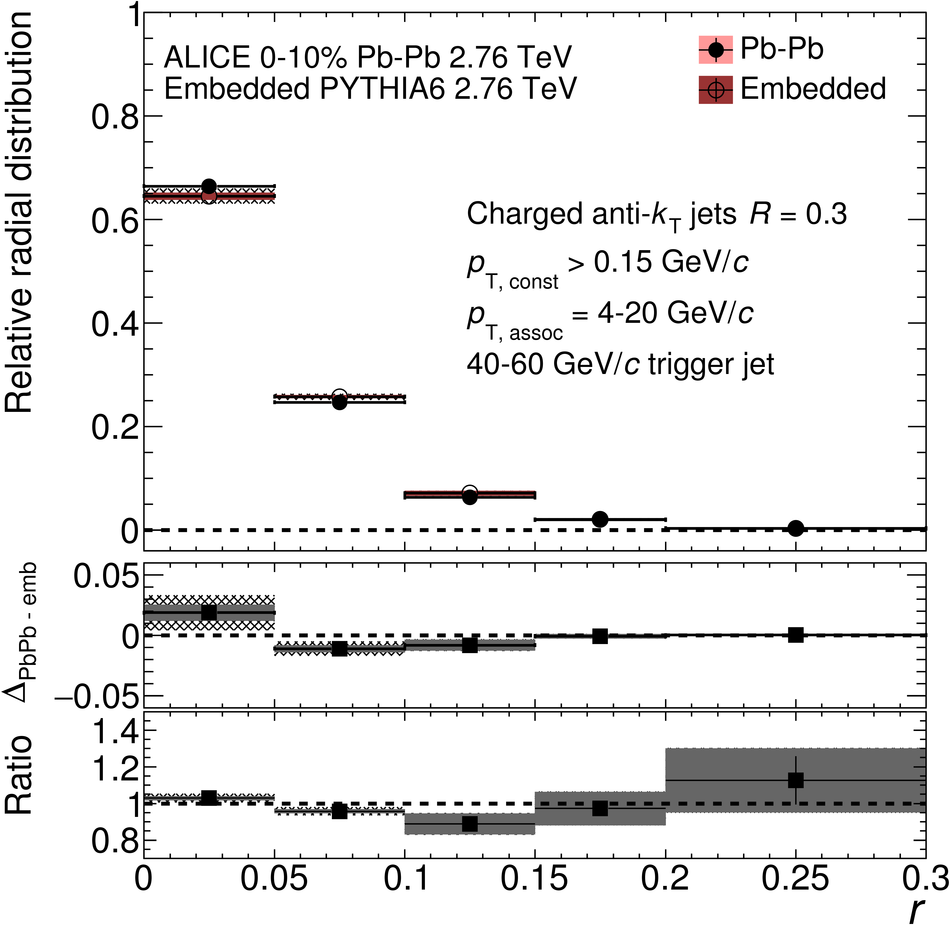  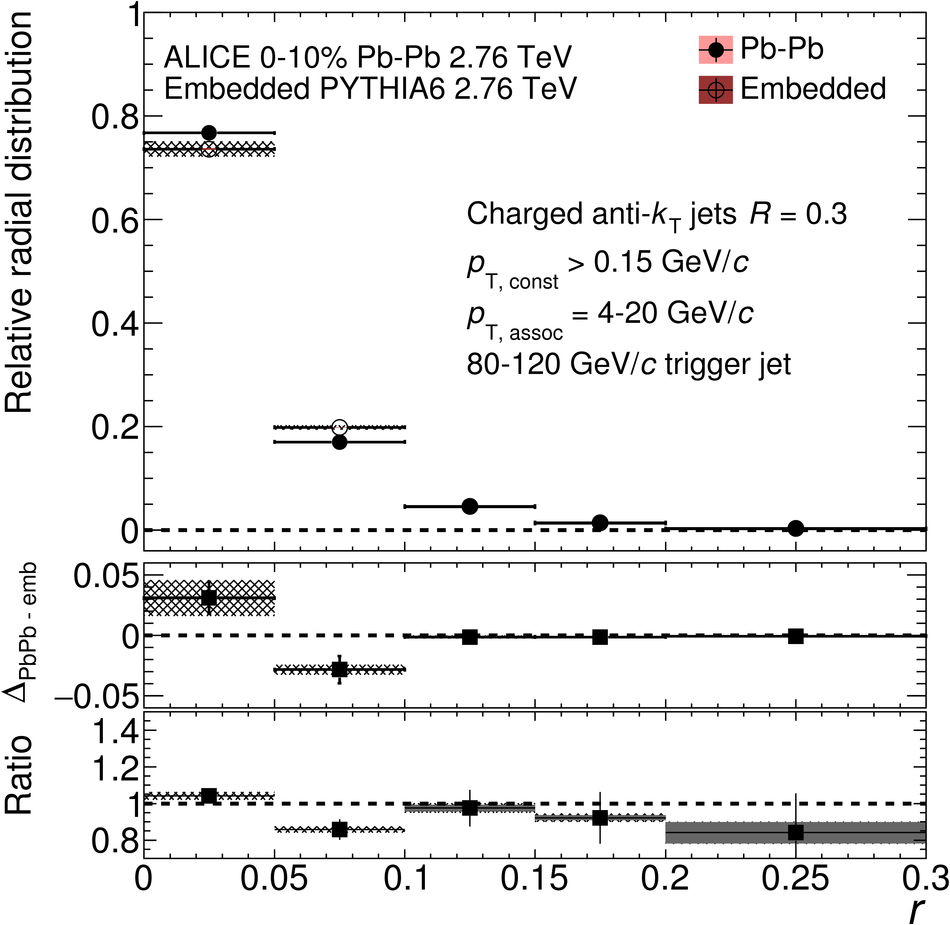 |