Collection of the \hyptriton lifetime measurements obtained with different experimental techniques. The vertical lines and boxes are the statistical and systematic uncertainties respectively. The orange band represents the average of the lifetime values and the lines at the edge correspond to 1$\sigma$ uncertainty. The dashed-dotted lines are four theoretical predictions. | 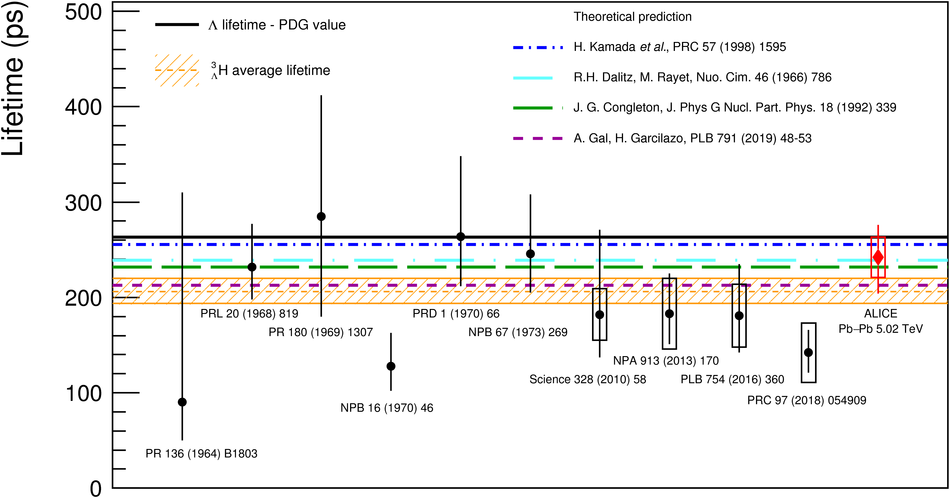 |