Comparison of radii obtained for different charged particle multiplicity intervals in the \pp collision system at $\sqrt{s}=7$\,TeV \cite{PhysRevD.84.112004,Abelev:2012sq, 2012151}. The error bars correspond to statistical and the shaded regions to the systematic uncertainties. The black point is the radius obtained in this analysis with \pP, \pL and \LL pairs, while the gray bar corresponds to the range of covered $m_{\mathrm{T}}$ in this analysis. | 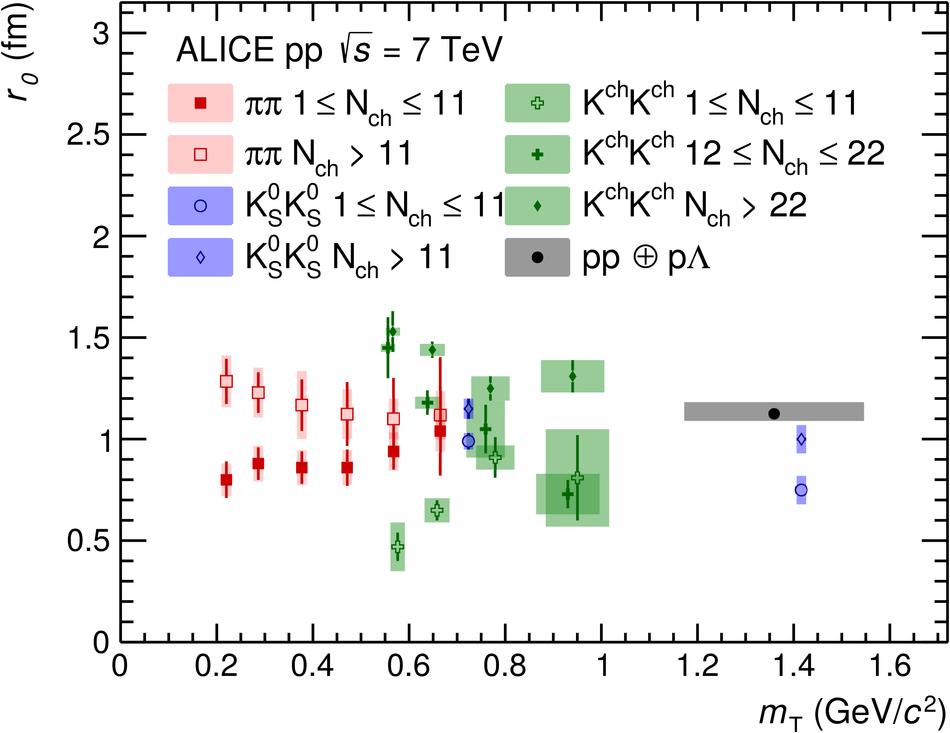 |