Production cross sections of muons from semi-leptonic decays of charm and beauty hadrons were measured at forward rapidity ($2.5<~y<~4$) in proton--proton (pp) collisions at a centre-of-mass energy $\sqrt{s}=5.02$ TeV with the ALICE detector at the CERN LHC. The results were obtained in an extended transverse momentum interval, $2 <~ p_{\rm T} <~ 20$ GeV/$c$, and with an improved precision compared to previous measurements performed in the same rapidity interval at centre-of-mass energies $\sqrt{s}= 2.76$ and 7 TeV. The $p_{\rm T}$- and $y$-differential production cross sections as well as the $p_{\rm T}$-differential production cross section ratios between different centre-of-mass energies and different rapidity intervals are described, within experimental and theoretical uncertainties, by predictions based on perturbative QCD.
JHEP 09 (2019) 008
HEP Data
e-Print: arXiv:1905.07207 | PDF | inSPIRE
CERN-EP-2019-078
Figure 3
$\pT$-differential production cross section of muons from heavy-flavour hadron decays at forward rapidity in pp collisions at $\sqrt s$ = 5.02 TeV. Statistical uncertainties (bars) and systematic uncertainties (boxes) are shown. The production cross section is compared with FONLL predictions (top). The ratio of the data to FONLL calculations is shown in the lower panel. See the text for details. | 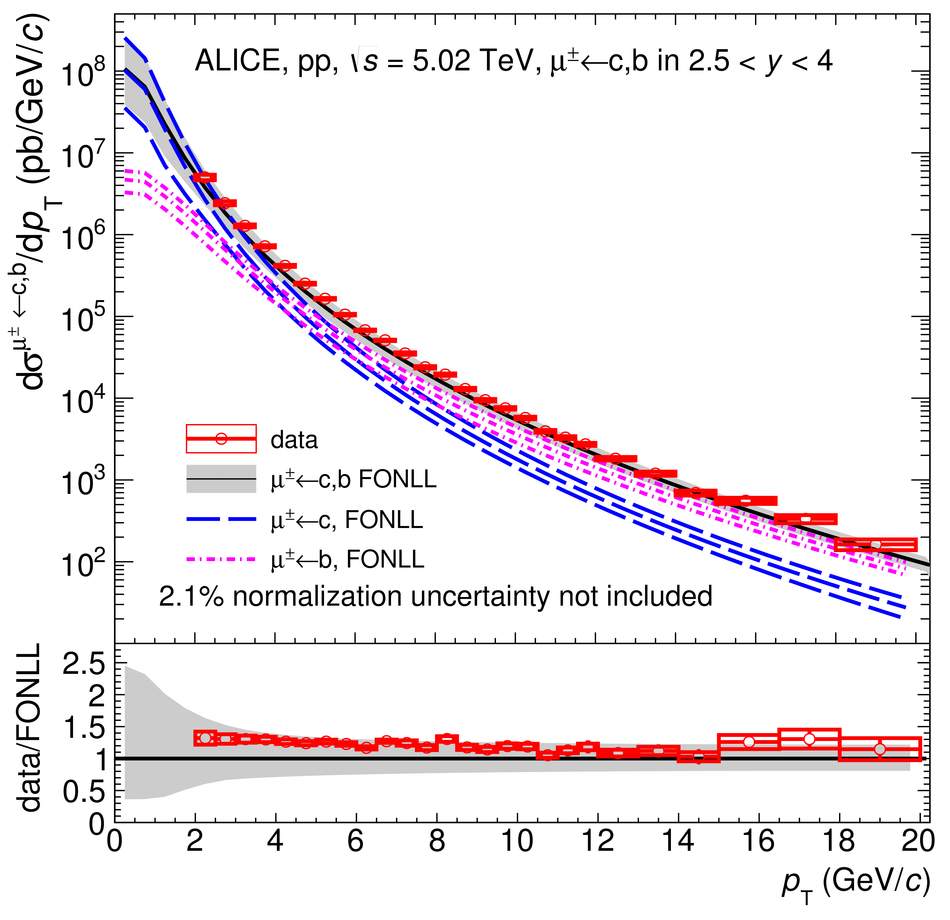 |
Figure 4
Production cross section of muons from heavy-flavour hadron decays as a function of rapidity in pp collisions at $\sqrt s$ = 5.02 TeV for the $\pT$ intervals $2 < p_{\rm T} < 7$ GeV/$c$ (left) and $7 < p_{\rm T} < 20$ GeV/$c$ (right). Statistical uncertainties (bars, smaller than symbols) and systematic uncertainties (boxes) are drawn. The production cross sections arecompared with FONLL predictions (top). The ratios of the data to FONLL calculations are shown in the lower panels. See the text for details. | 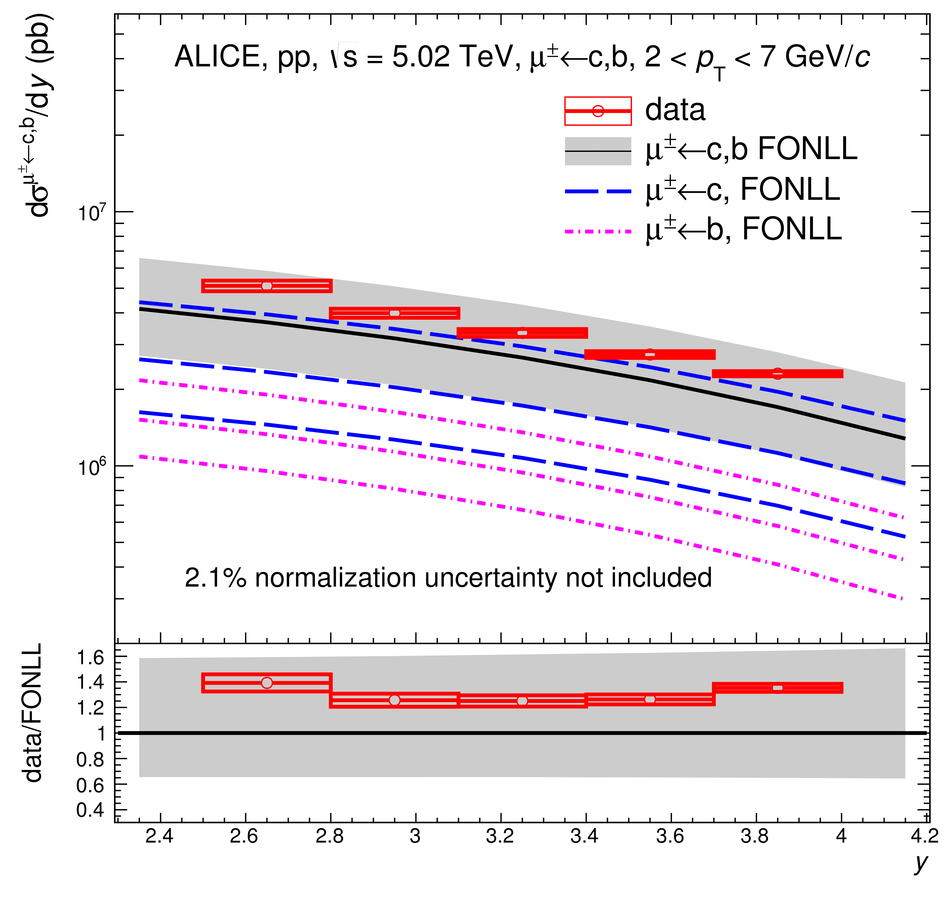 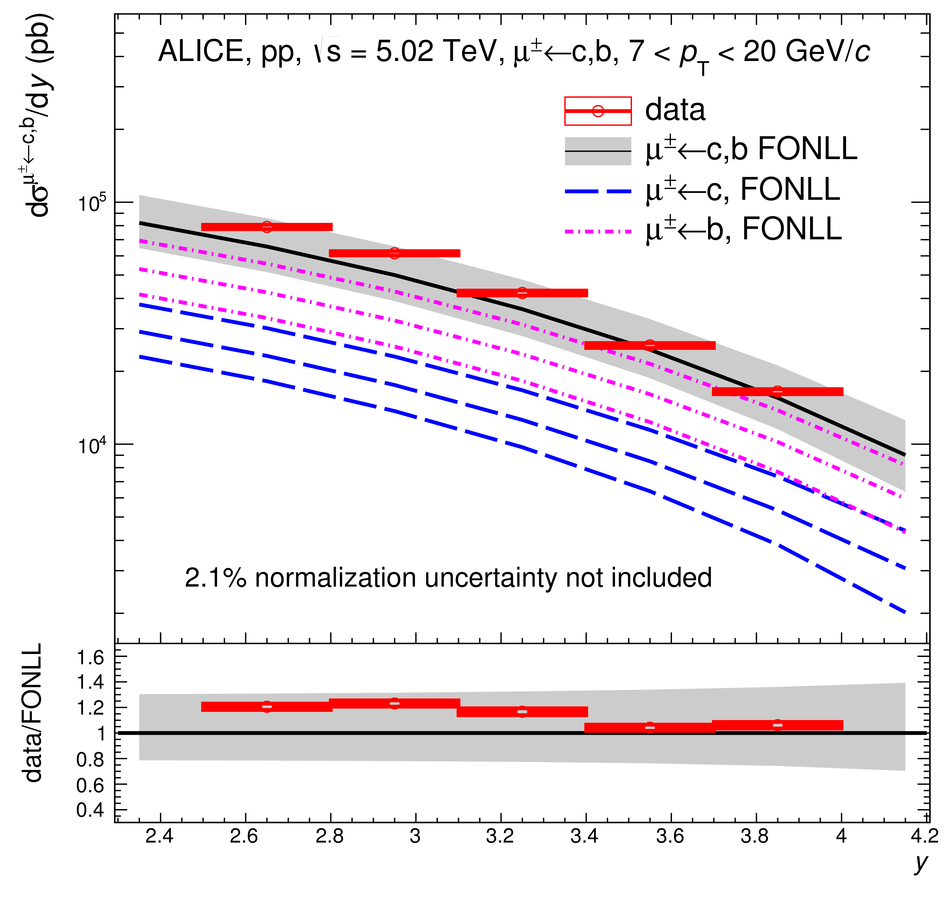 |
Figure 5
Upper panel: $\pT$-differential production cross section of muons from heavy-flavour hadron decays for five rapidity intervals in the range $2.5 < y < 4$ in pp collisions at $\sqrt s$ = 5.02 TeV. Statistical uncertainties (bars) and systematic uncertainties (boxes) are shown. The production cross sections are compared with FONLL predictions . Bottom panel: ratios of the data to FONLL calculations. See the text for details. | 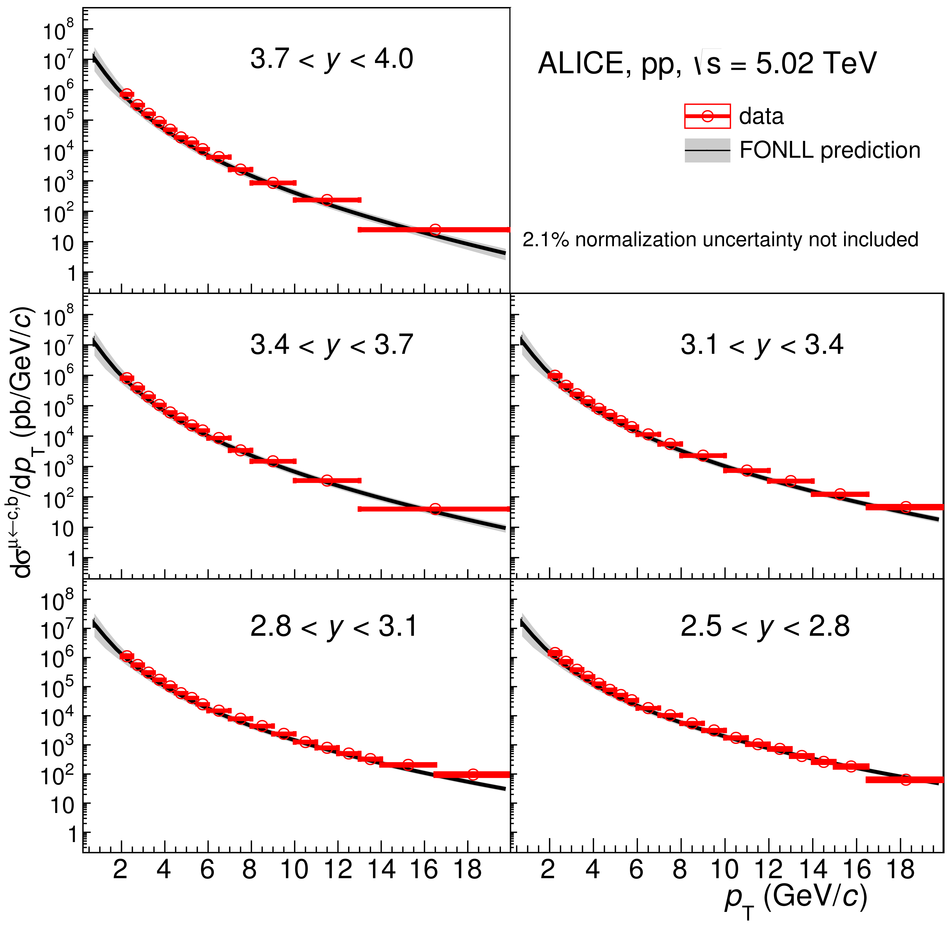 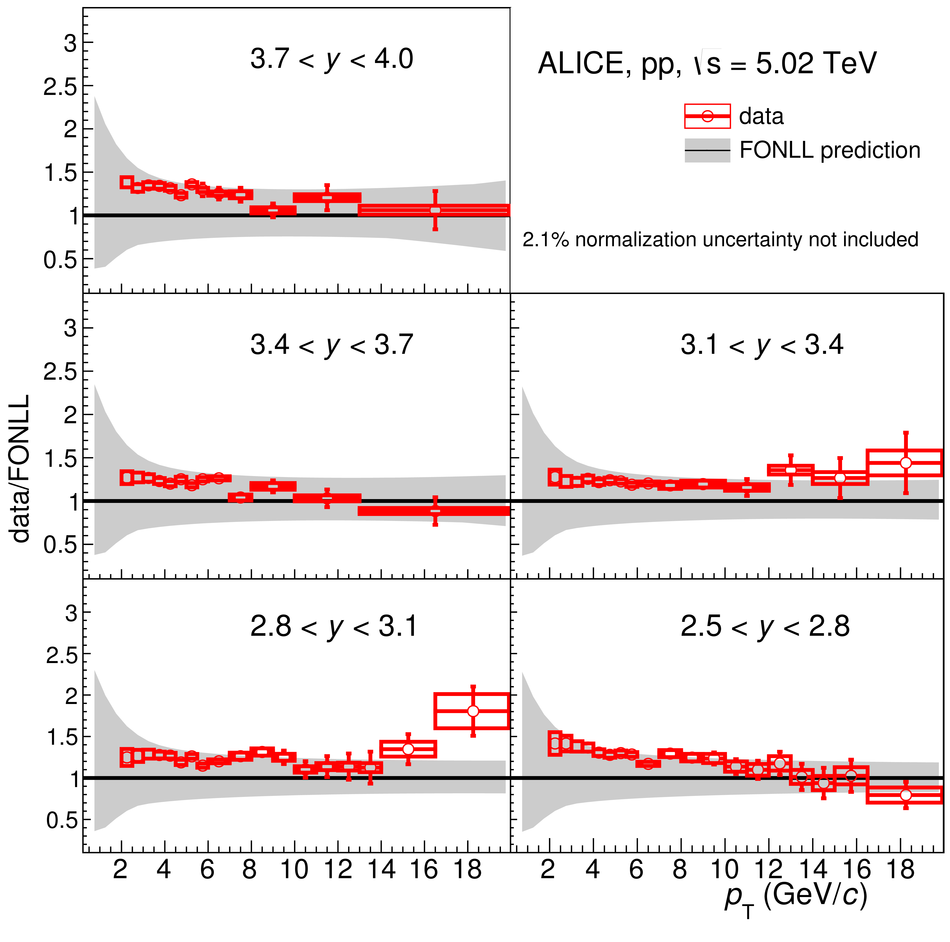 |
Figure 6
Ratio of the $\pT$-differential production cross section of muons from heavy-flavour hadron decays at forward rapidity in pp collisions at $\sqrt s$ = 7 TeV to that at $\sqrt s$ = 5.02 TeV. Statistical uncertainties (bars) and systematic uncertainties (boxes) are shown. The normalisation uncertainty contains the uncertainties on the luminosity at the two centre-of mass energies. The ratio is compared with FONLL predictions . See the text for details. |  |
Figure 7
Ratio of the $\pT$-differential production cross section of muons from heavy-flavour hadron decays in $3.7 < y < 4$ to that in $2.5 < y < 2.8$ in pp collisions at $\sqrt s$ = 5.02 TeV. Statistical uncertainties (bars) and systematic uncertainties (boxes) are shown. The ratio is compared with FONLL predictions . See the text for details. | 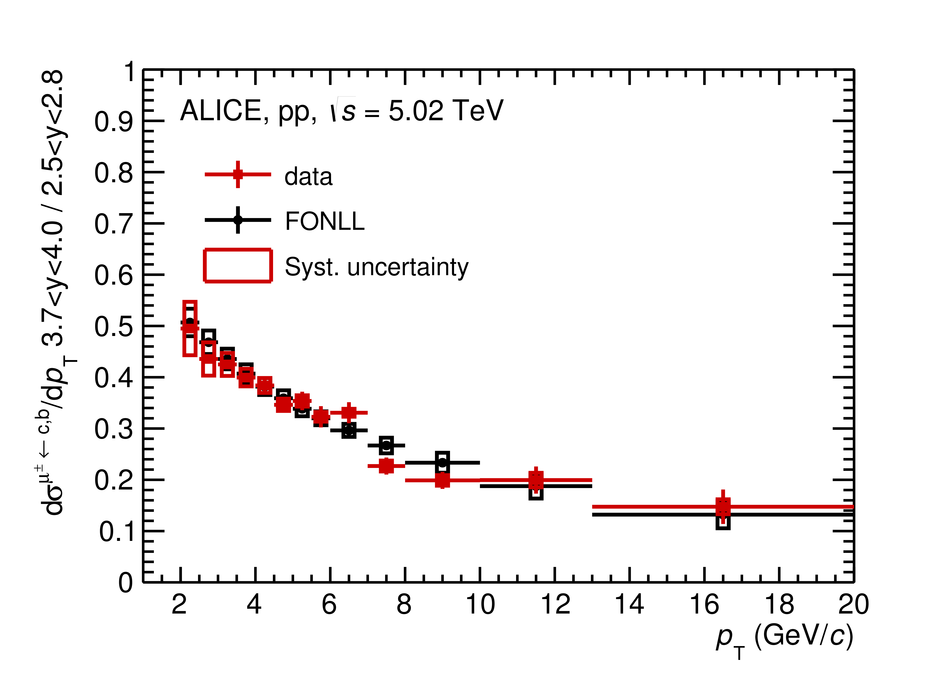 |