The mean values of the coefficient $c_{\rm 1}$ are shown as filled (red) circles for different centralities. These correspond to the ratio of $\dNdeta$ distributions of populations of events demarcated by $\alpha_{\rm{ZN}}^{\rm{cut}}$ = 0.1. The squares show the corresponding values from simulations, and correspond to $\alpha_{\rm{ZN}}^{\rm{cut}}$ = 0.1 in Fig. \ref{fig:Meany0vsAsym}, for different centralities. The systematic uncertainties are shown as bands. | 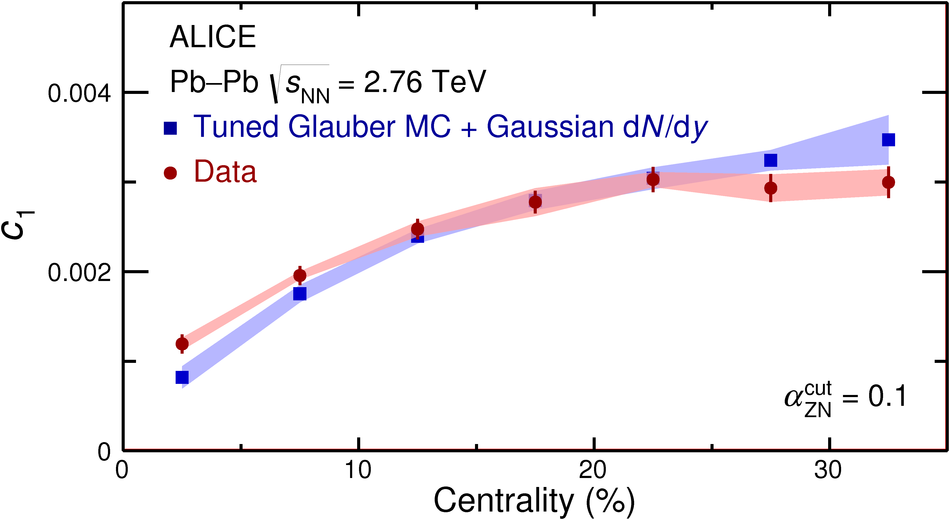 |