(a) The estimated mean value of rapidity-shift $\langle y_{\rm 0} \rangle$ for the asymmetric region characterised by different values of $\alpha_{\rm{ZN}}^{\rm{cut}}$ for each centrality interval. (b) The coefficient $c_{\rm 1}$ characterising the change in the pseudorapidity distributions for different values of $\alpha_{\rm{ZN}}^{\rm{cut}}$, for each centrality interval. These results are obtained using TGMC and simulated pseudorapidity distributions, as described in the text | 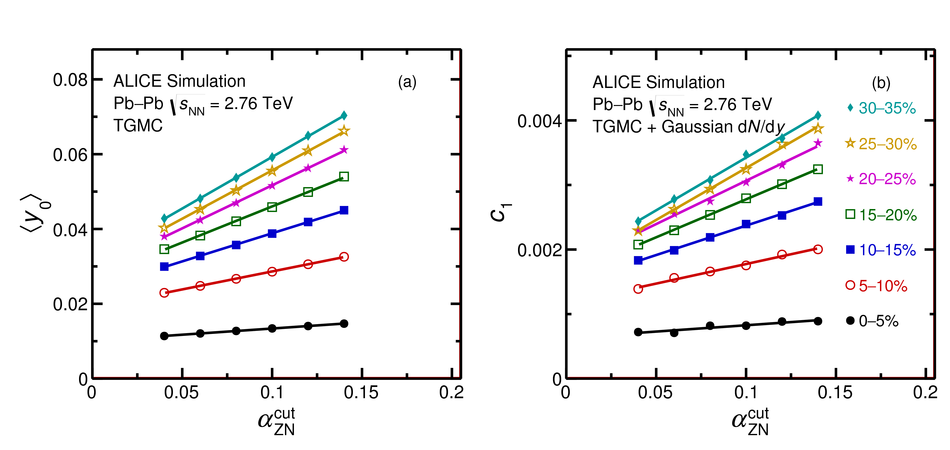 |