Mass distribution of antitriton (crosses) and$^{3}\overline{\text{He}}$ nucleus (diamonds) candidates obtainedwith the TOF detector as a function of the total momentum. The green and yellowbands represent 1$\sigma$ and 2$\sigma$ intervals, respectively, around the expected $^{3}$He mass(dashed line), obtained from the TOF resolution. | 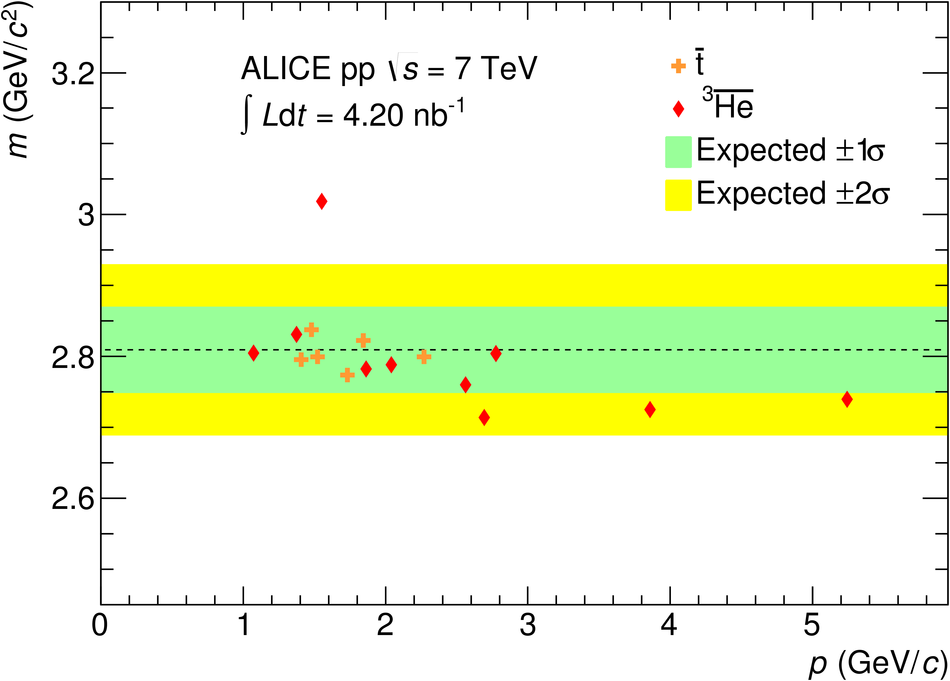 |