The measurements of the production of prompt ${\rm D^0}$, ${\rm D^+}$, ${\rm D^{*+}}$, and ${{\rm D^+}_s}$ mesons in proton--proton (pp) collisions at $\sqrt{s}=5.02$ TeV with the ALICE detector at the Large Hadron Collider (LHC) are reported. D mesons were reconstructed at mid-rapidity ($|y|<~0.5$) via their hadronic decay channels ${\rm D}^0 \to {\rm K}^-\pi^+$, ${\rm D}^+\to {\rm K}^-\pi^+\pi^+$, ${\rm D}^{*+} \to {\rm D}^0 \pi^+ \to {\rm K}^- \pi^+ \pi^+$, ${\rm D^{+}_{s}\to \phi\pi^+\to K^{+} K^{-} \pi^{+}}$, and their charge conjugates. The production cross sections were measured in the transverse momentum interval $0<~p_{\rm T}<~36~\mathrm{GeV}/c$ for ${\rm D^0}$, $1<~p_{\rm T}<~36~\mathrm{GeV}/c$ for ${\rm D^+}$ and ${\rm D^{*+}}$, and in $2<~p_{\rm T}<~24~\mathrm{GeV}/c$ for ${{\rm D^+}_s}$ mesons. Thanks to the higher integrated luminosity, an analysis in finer $p_{\rm T}$ bins with respect to the previous measurements at $\sqrt{s}=7$ TeV was performed, allowing for a more detailed description of the cross-section $p_{\rm T}$ shape. The measured $p_{\rm T}$-differential production cross sections are compared to the results at $\sqrt{s}=7$ TeV and to four different perturbative QCD calculations. Its rapidity dependence is also tested combining the ALICE and LHCb measurements in pp collisions at $\sqrt{s}=5.02$ TeV. This measurement will allow for a more accurate determination of the nuclear modification factor in p-Pb and Pb-Pb collisions performed at the same nucleon-nucleon centre-of-mass energy.
Eur.Phys.J. C79 (2019) no.5, 388
HEP Data
e-Print: arXiv:1901.07979 | PDF | inSPIRE
Figure 1
Invariant-mass (mass-difference) distributions of $\Dzero$, $\Dplus$, $\Dstar$, and $\Ds$ candidates and charge conjugates in $1.5< \pt< 2 \gevc$, $16< \pt< 24 \gevc$, $7< \pt< 7.5 \gevc$, and $3< \pt< 4 \gevc$ intervals, respectively. The blue solid lines show the total fit functions as described in the text and the red dashed lines are the combinatorial-background terms. In case of $\Dzero$, the grey dashed line represents the combinatorial background with the contribution of the reflections. The values of the mean ($\mu$) and the width ($\sigma$) of the signal peak are reported together with the signal counts ($S$) and the signal over background ratio ($S/B$) in the mass interval ($\mu-3\sigma,\mu+3\sigma$). The reported uncertainties are only the statistical uncertainties from the fit. |   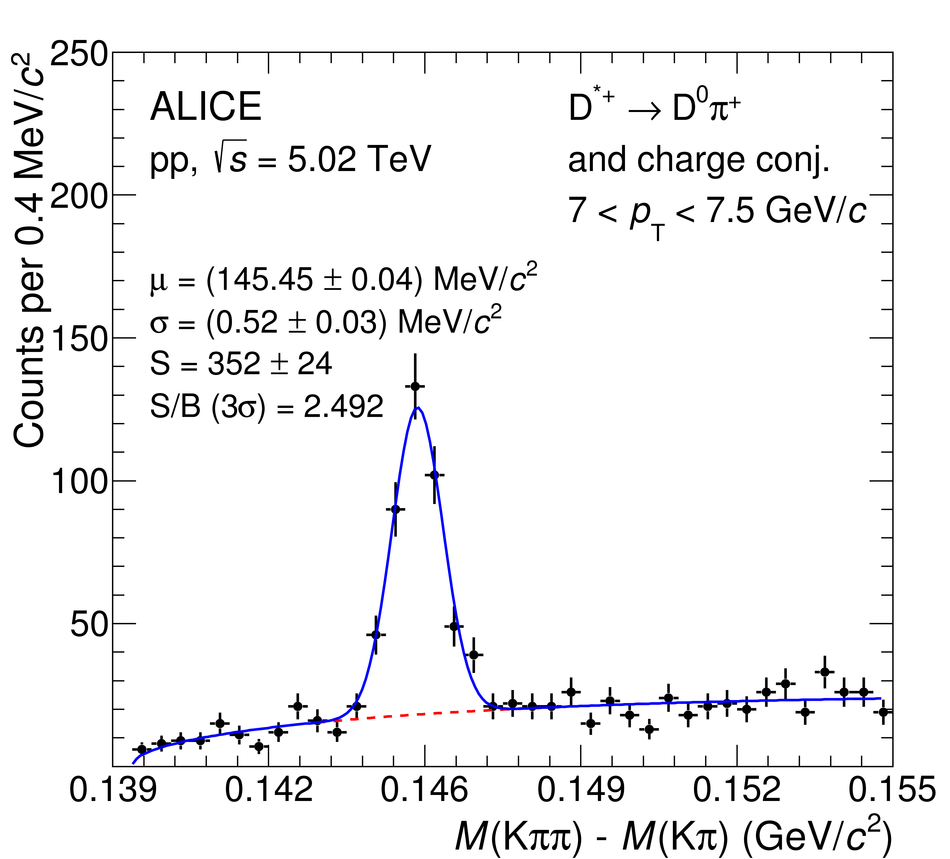 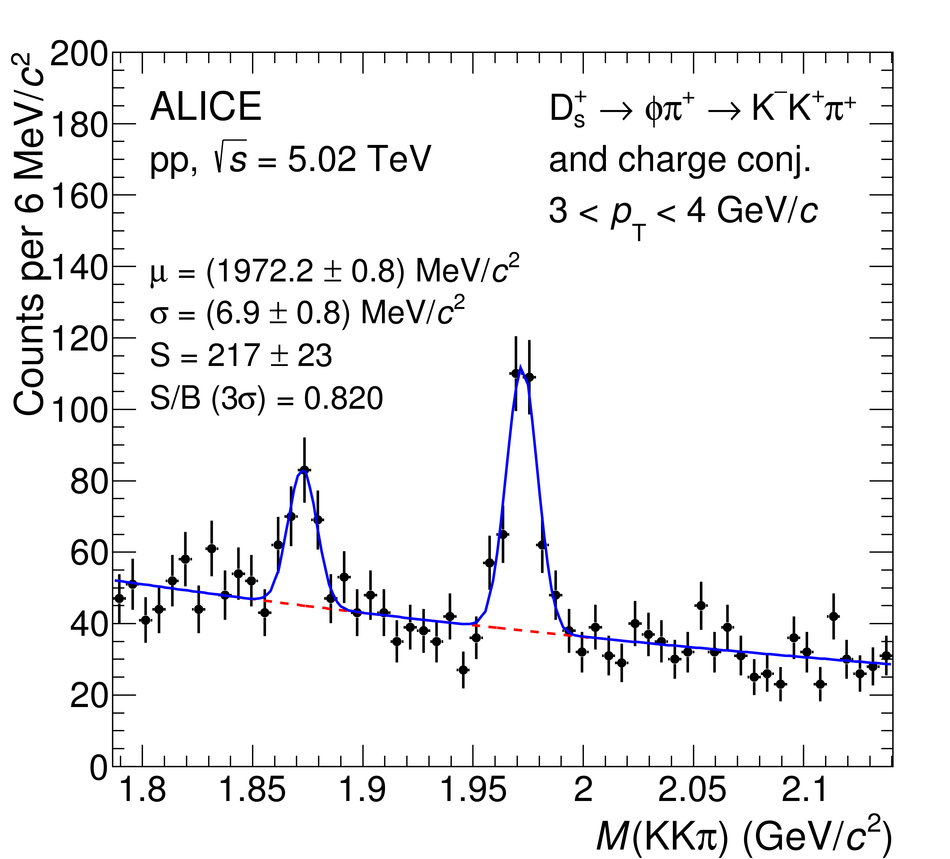 |

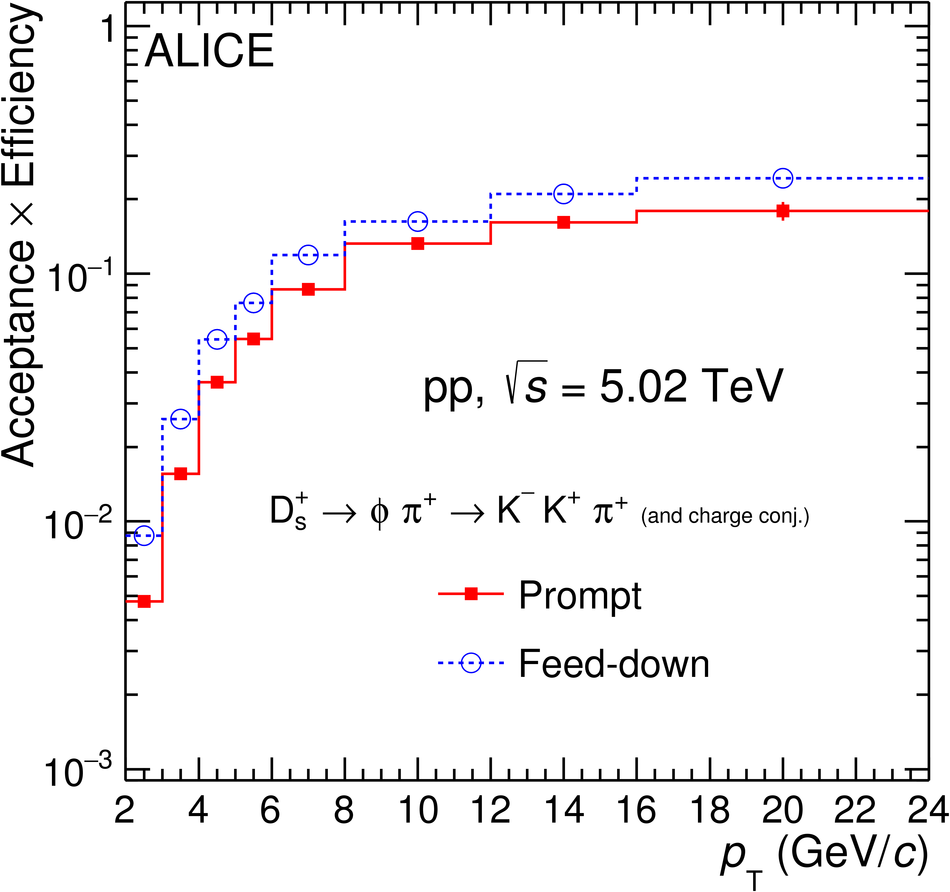
Figure 3
Invariant-mass distributions of $\DtoKpi$ candidates (andcharge conjugates) for $0< \pt< 0.5 \gev/c$. The left panel displaysthe invariant-mass distribution of all opposite-sign K$\pi$ pairs (or unlike sign, ULS in the legend) together with thebackground distribution estimated with the track-rotation technique. The right panel shows the invariant-mass distributions after subtraction of the background from the track-rotation technique. The blue solid line shows the total fit function as described in the text and the grey dashed line is the residual background after the subtraction of the background from the track-rotation technique. | 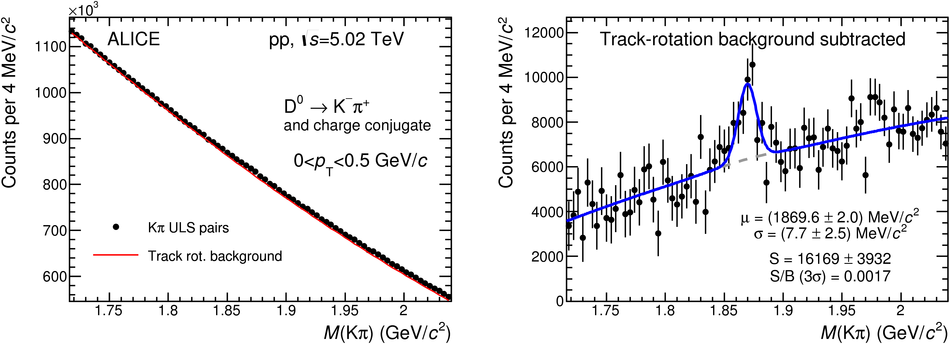 |
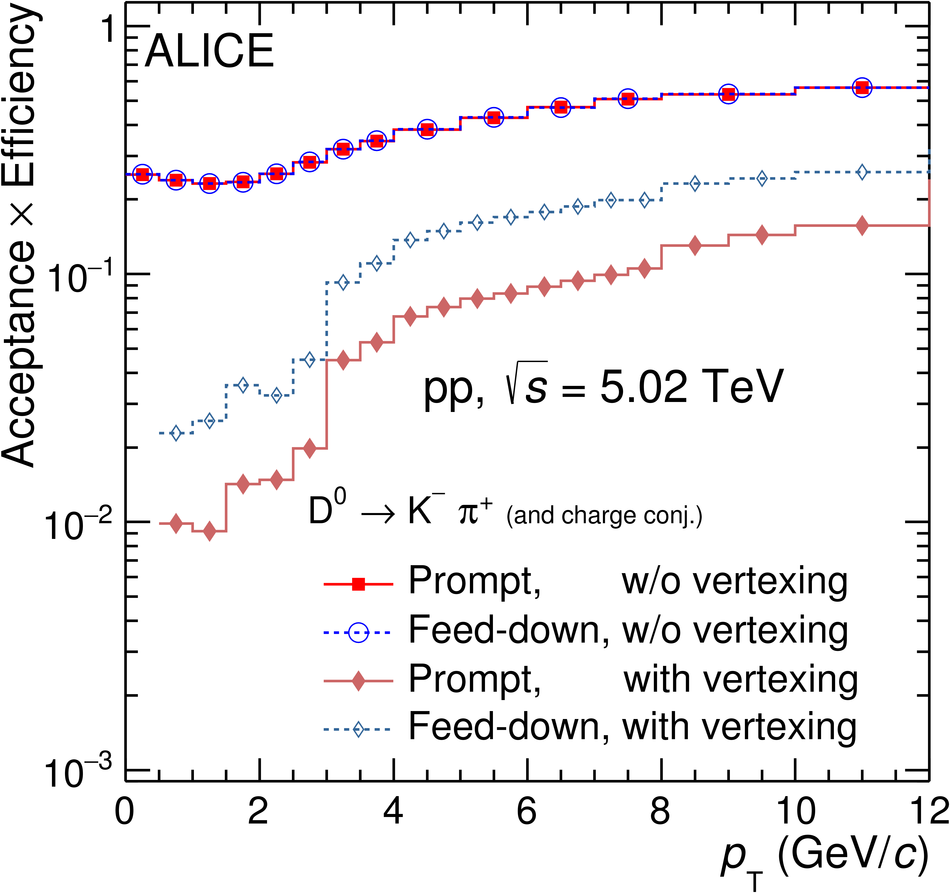
Figure 5
Left: examples of fits to the impact-parameter distributions of $\Dzero$ and $\Ds$ candidates. The curves show the fit functions describing the prompt, feed-down, and background contributions, as well as their sum, as described in the text Right: fraction of prompt $\Dzero$ and $\Ds$-mesons raw yield as a function of $\pt$ compared to the values obtained with the FONLL-based approach. The results from the data-driven method are shown as square markers with the error bars (boxes) representing the statistical (systematic) uncertainty. The central values of $\fprompt$ from the FONLL-based approach are shown by the dashed line and their uncertainty by the red boxes | 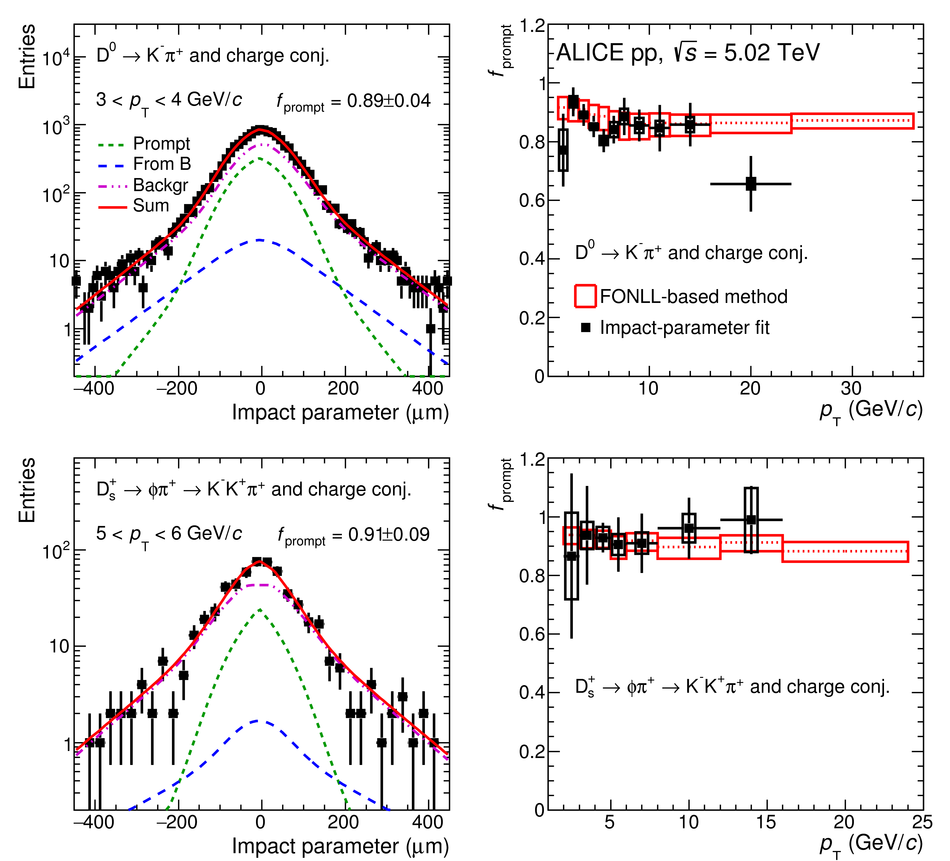 |
Figure 6
Prompt $\Dzero$-meson $\pt$-differential production cross section in $|y|< 0.5$ in pp collisions at $\sqrts =5.02 \tev$ measured with and without decay-vertex reconstruction. The inset shows the ratio of the measurements in their common $\pt$ range. The vertical error bars and the empty boxes represent the statistical and systematic uncertainties, respectively. |  |
Figure 7
$\pt$-differential production cross section of prompt $\Dzero$, $\Dplus$, $\Dstar$, and $\Ds$ mesons in pp collisionsat $\sqrts=5.02 \tev$. Statistical uncertainties (bars) and systematic uncertainties (boxes) are shown. For the $\Dzero$ meson, the results in $0< \pt< 1 \gev/c$ are obtained from the analysis without decay-vertex reconstruction, while those in \mbox{$1< \pt< 36 \gev/c$} are taken from the analysis with decay-vertex reconstruction. The $\Dstar$-meson cross section is scaled by a factor of 5 for better visibility |  |
Figure 8
$\pt$-differential production cross sections for prompt $\Dzero$ meson compared to pQCD calculations: FONLL , GM-VFNS(mod-$\mu_{\rm R,F}$) , GM-VFNS(SACOT-$m_{\rm T}$) , and $k_{\rm T}$-factorisation . The ratios of the data to the theoretical predictions are shown in the lower part of each panel. | 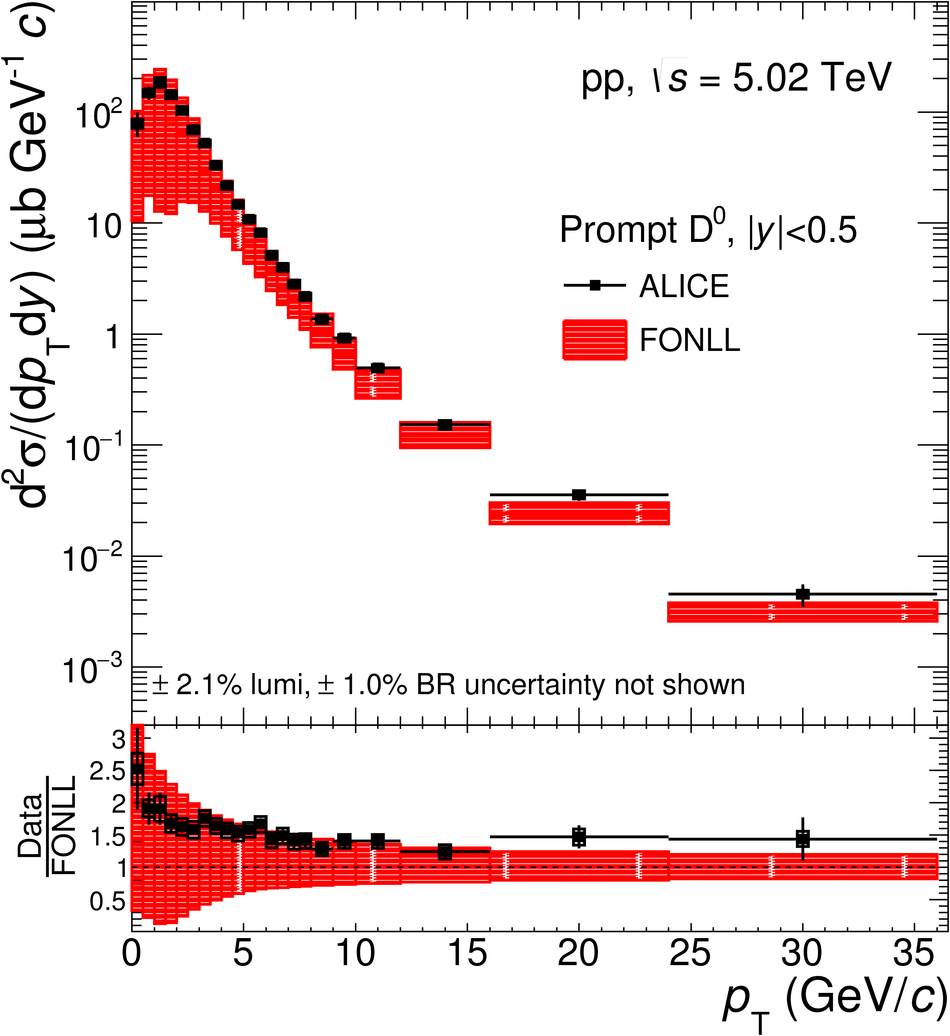 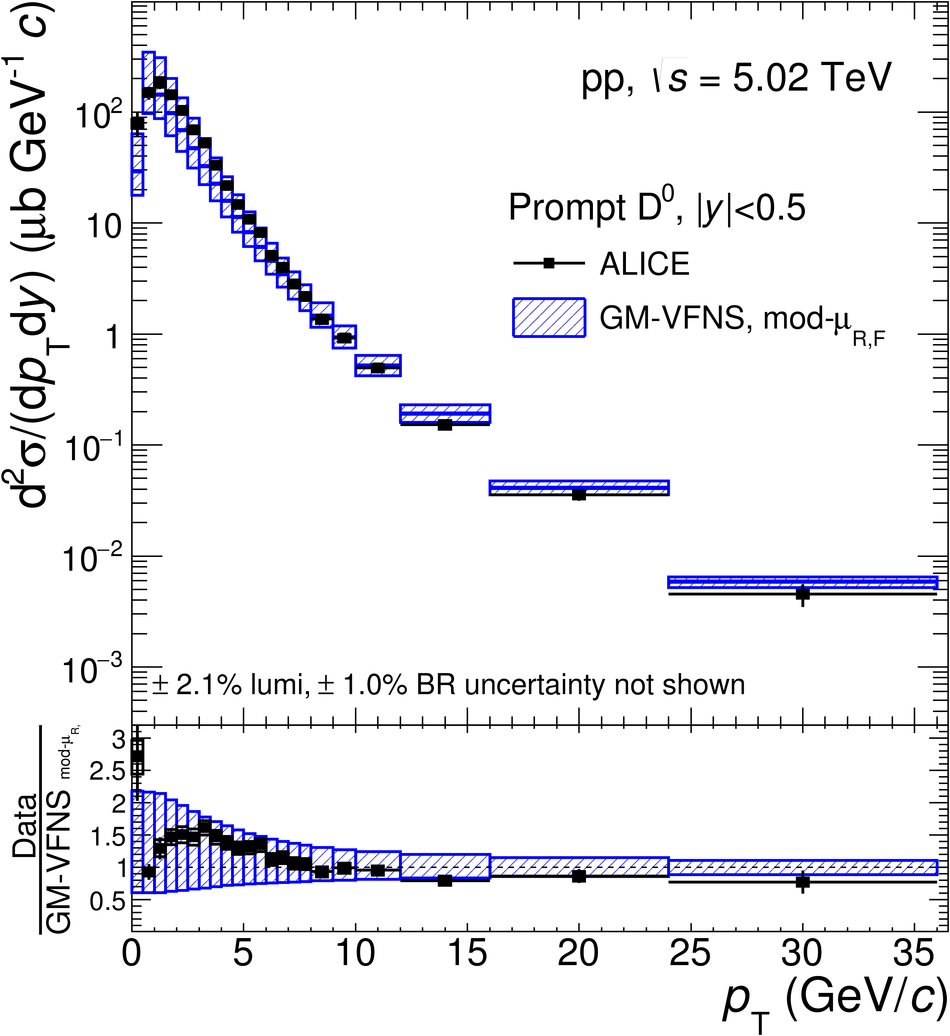 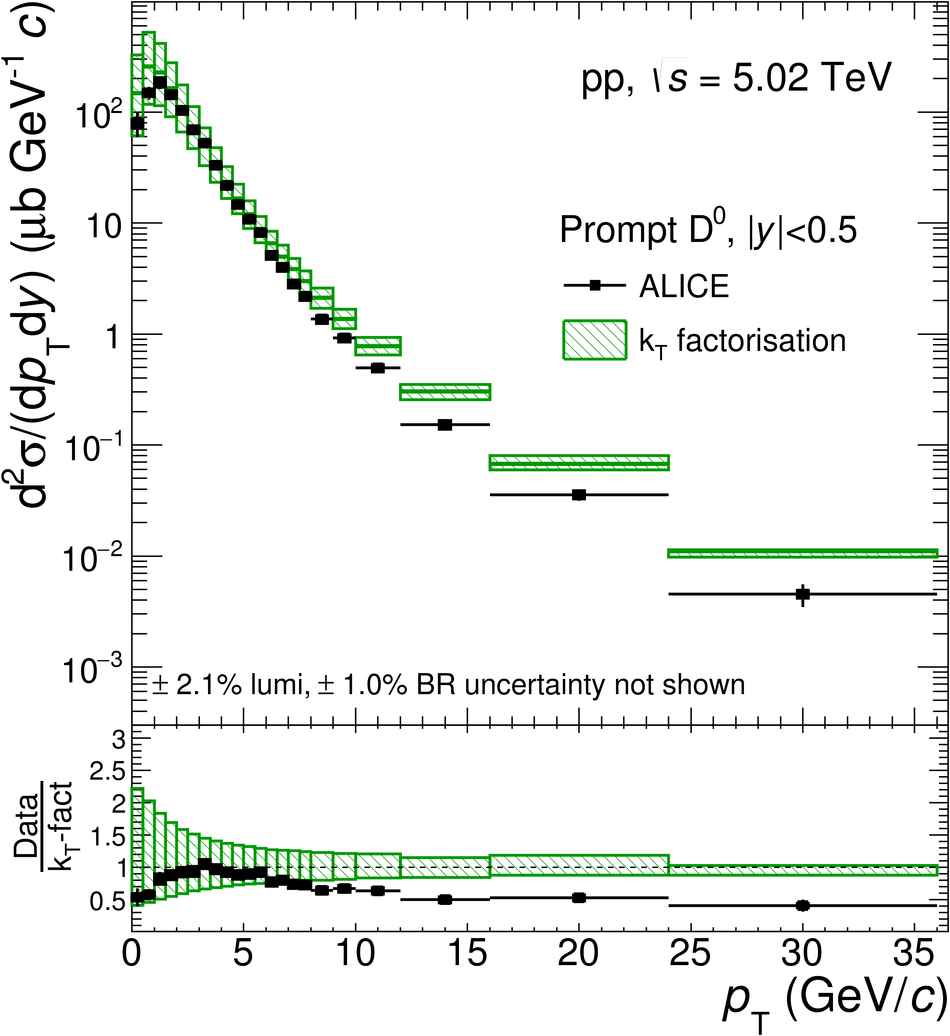  |
Figure 9
$\pt$-differential production cross sections for prompt $\Dplus$ meson compared to pQCD calculations: FONLL , GM-VFNS(mod-$\mu_{\rm R,F}$) , GM-VFNS(SACOT-$m_{\rm T}$) , and $k_{\rm T}$-factorisation . The ratios of the data to the theoretical predictions are shown in the lower part of each panel. | 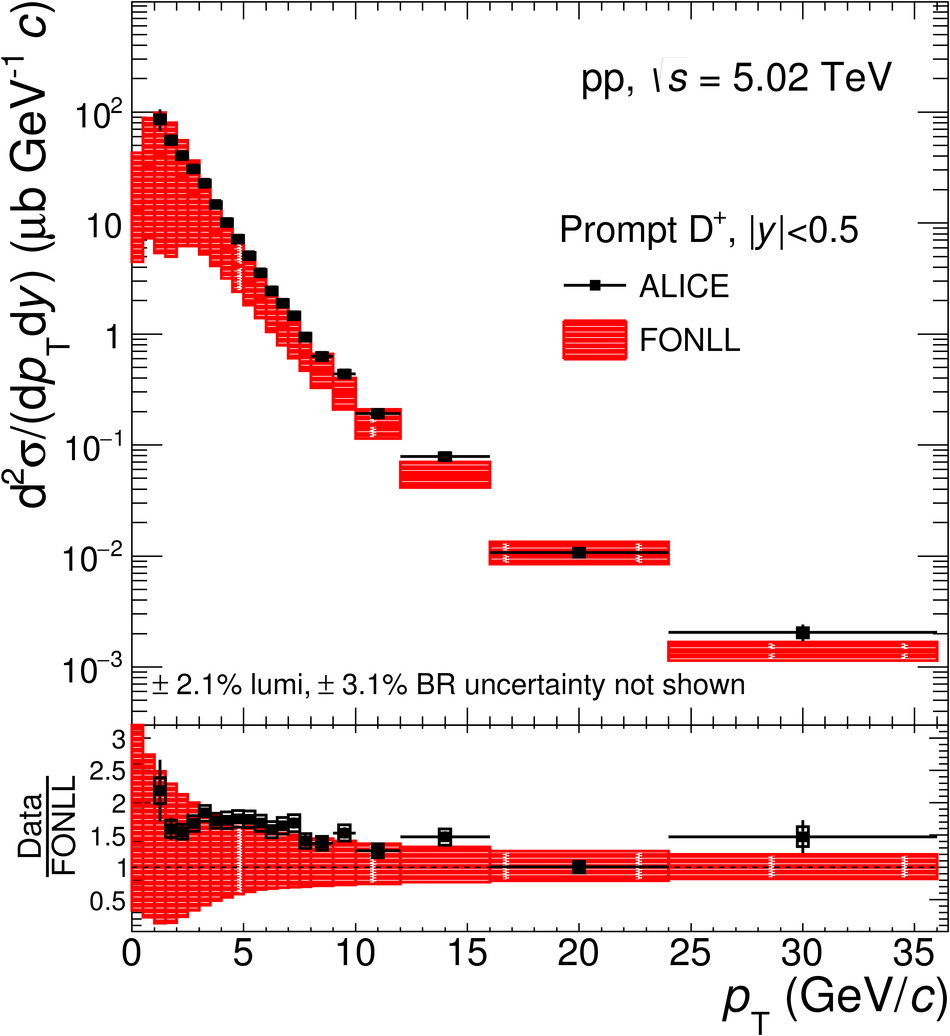   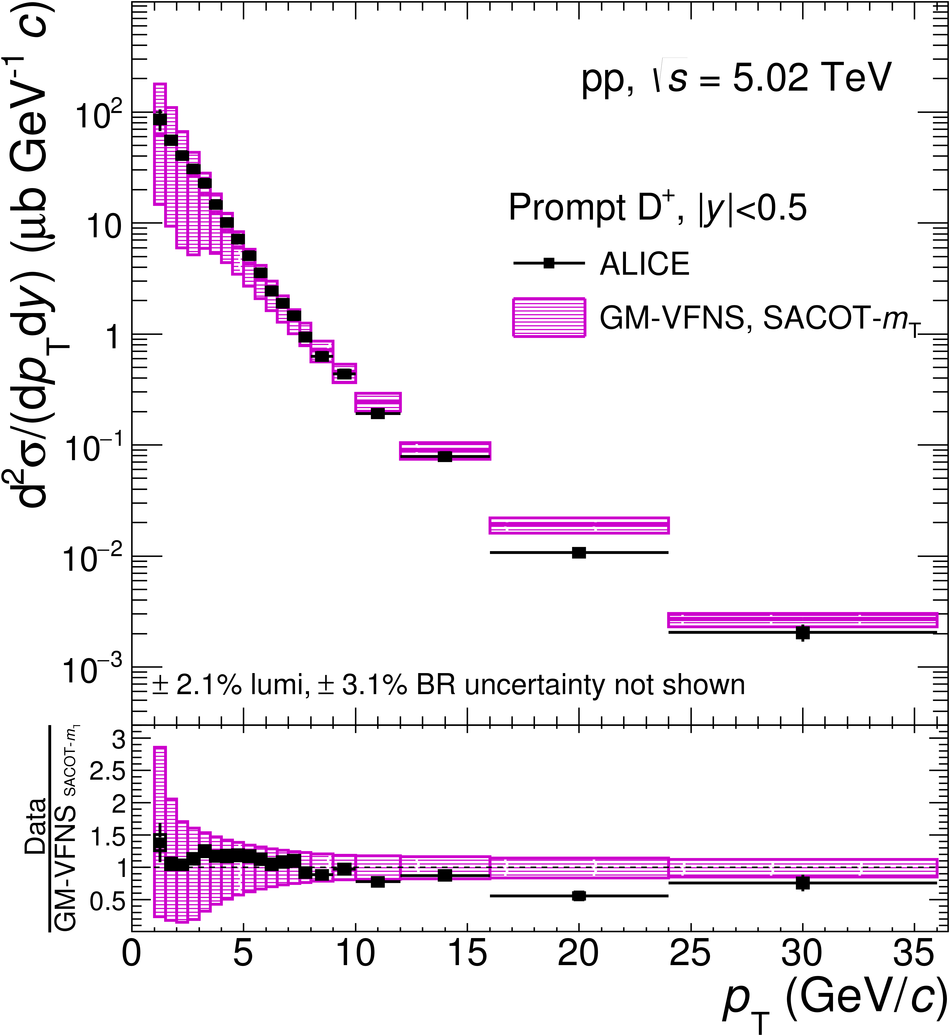 |
Figure 10
$\pt$-differential production cross sections for prompt $\Dstar$ meson compared to pQCD calculations: FONLL , GM-VFNS(mod-$\mu_{\rm R,F}$) , GM-VFNS(SACOT-$m_{\rm T}$) , and $k_{\rm T}$-factorisation . The ratios of the data to the theoretical predictions are shown in the lower part of each panel. | 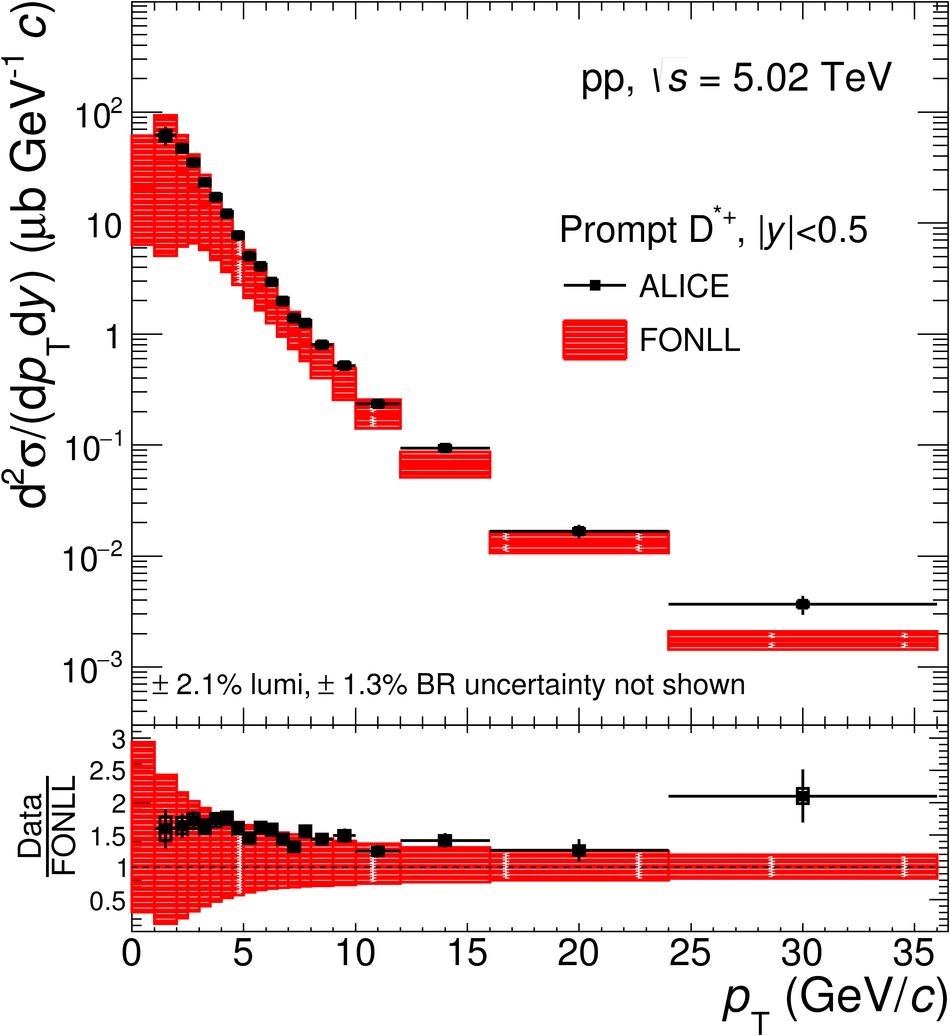 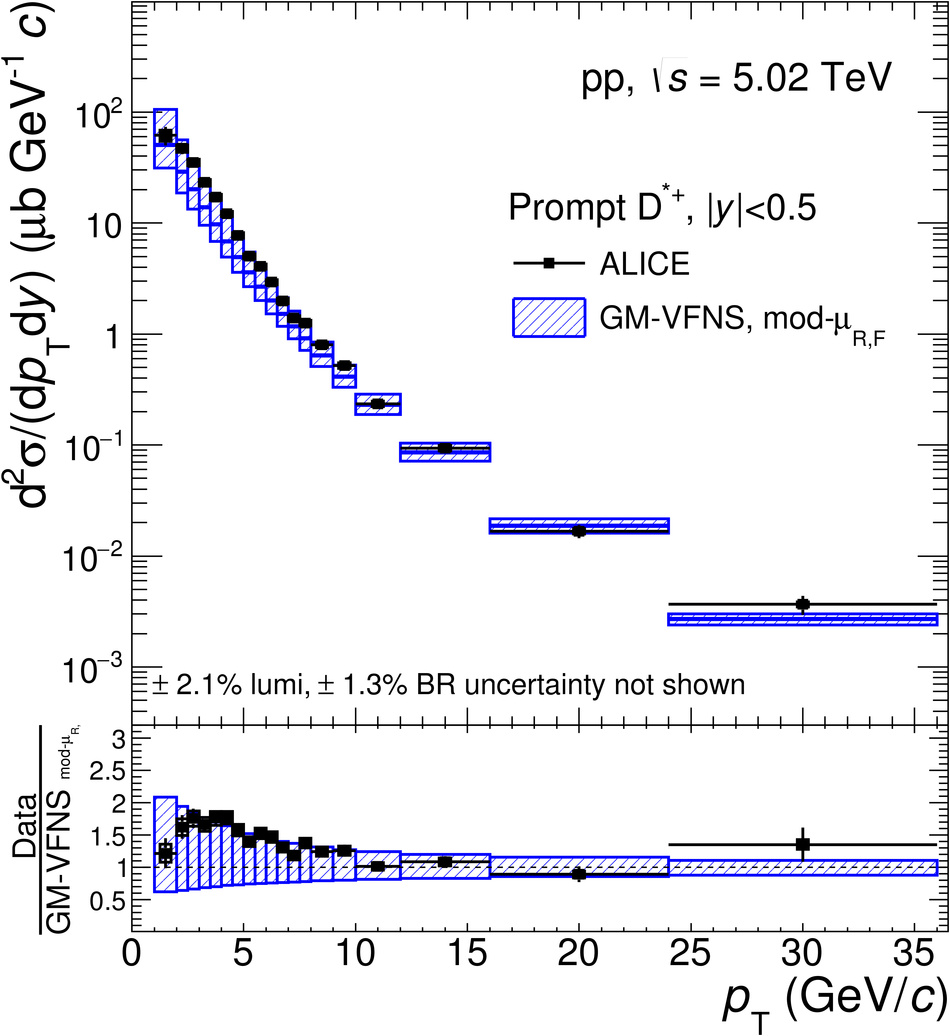 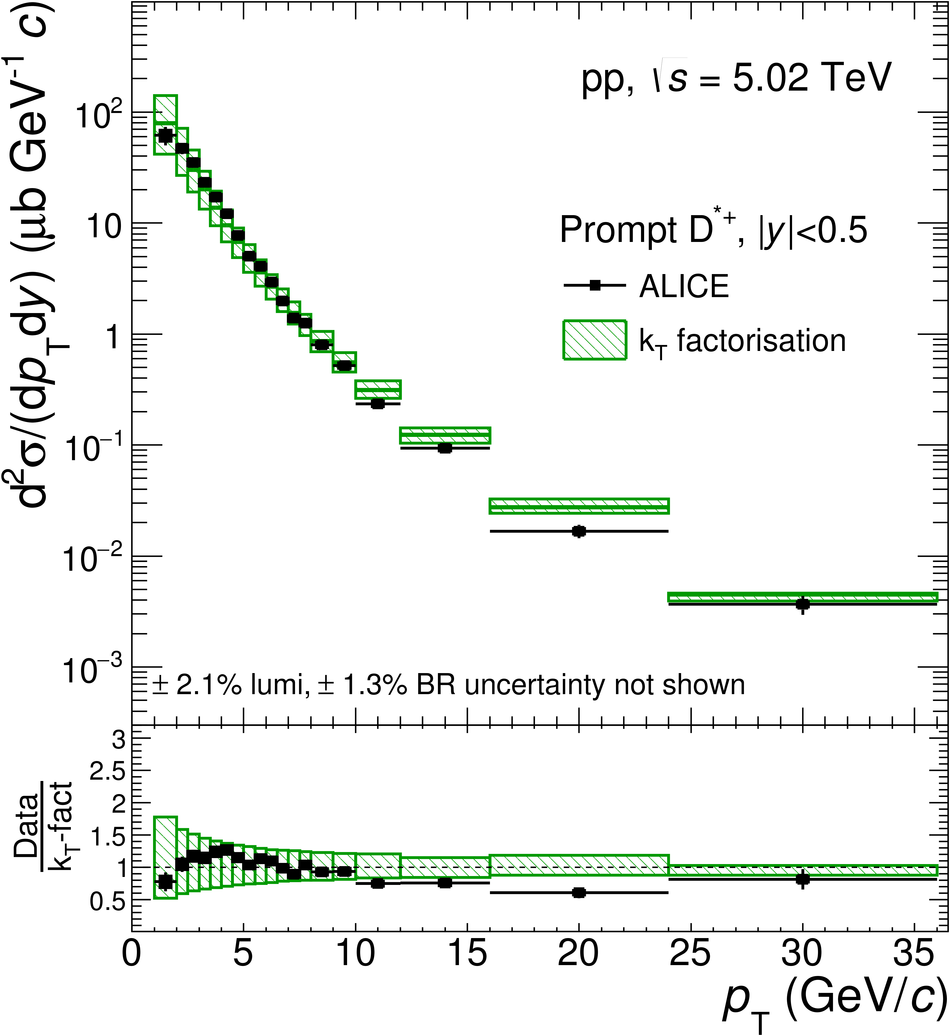  |
Figure 11
$\pt$-differential production cross sections for prompt $\Ds$ meson compared to GM-VFNS(mod-$\mu_{\rm R,F}$) , GM-VFNS(SACOT-$m_{\rm T}$) , and $k_{\rm T}$-factorisation pQCD calculations. The ratios of the data to the theoretical predictions are shown in the lower part of each panel. |  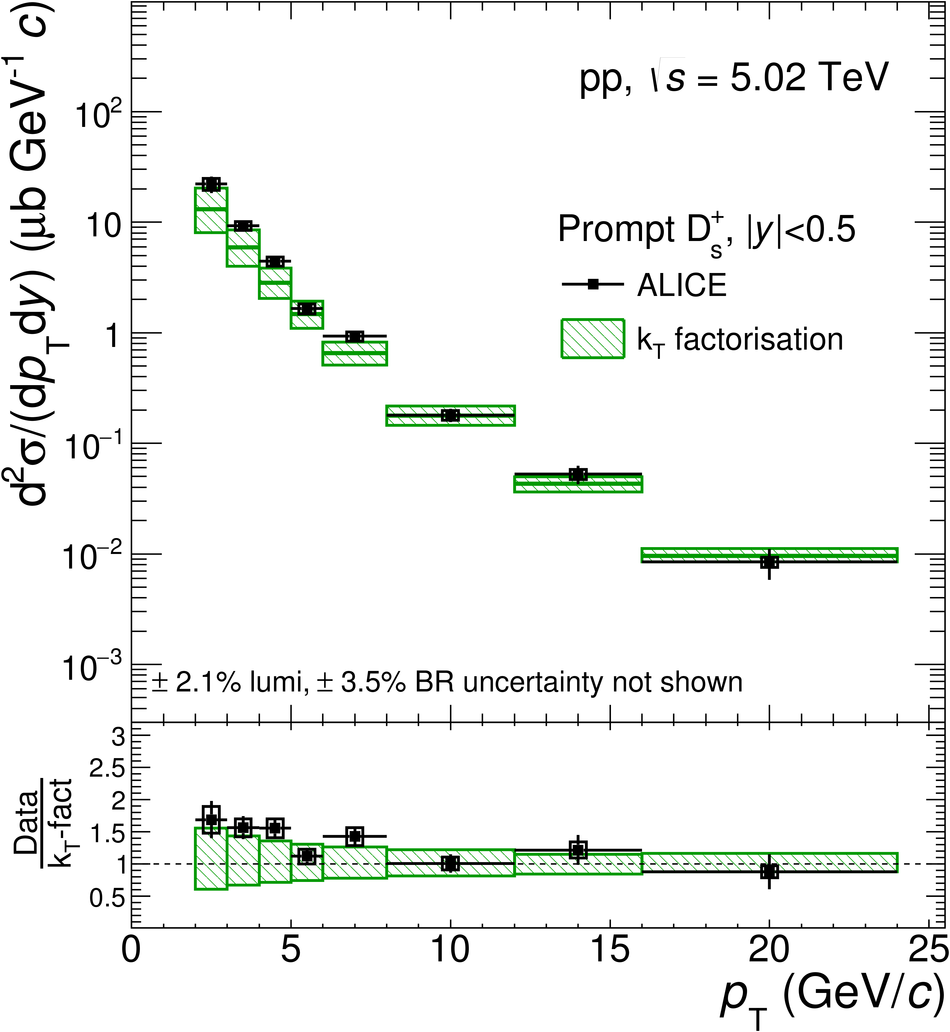 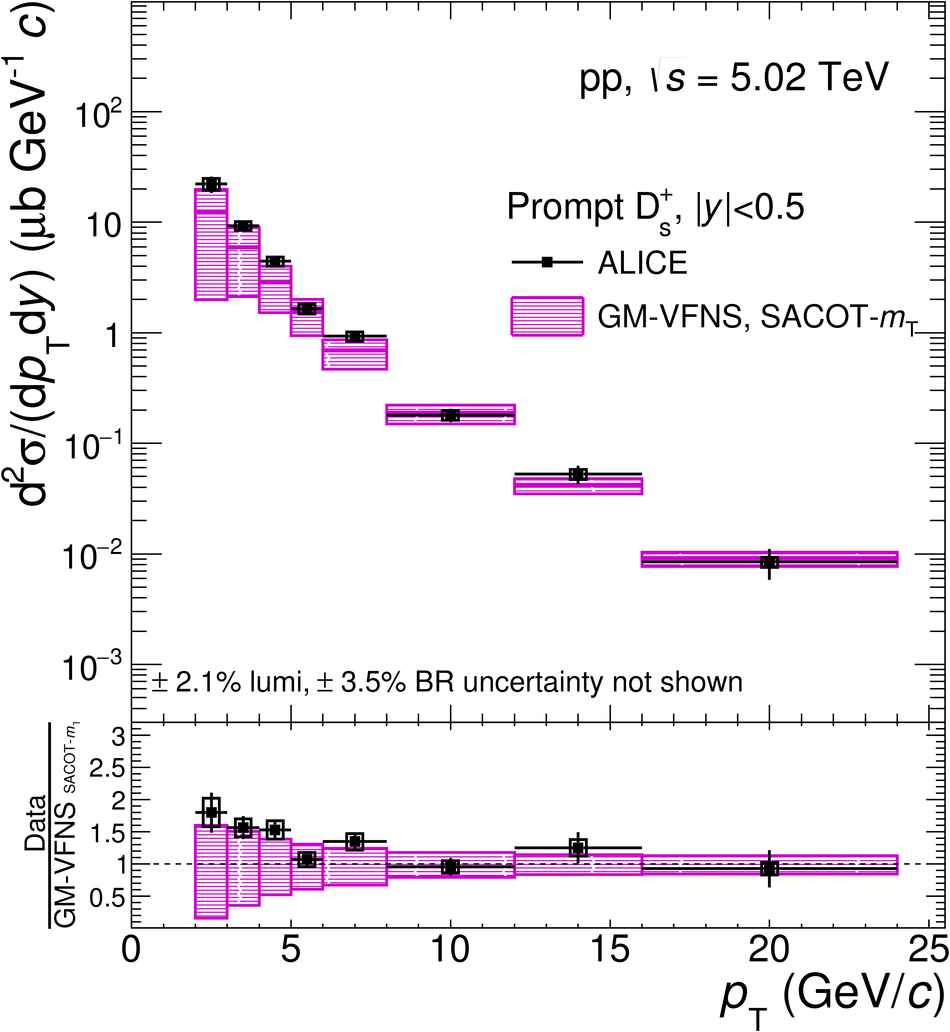 |
Figure 12
Inclusive $\Dzero$ mesons (including also $\Dzero$ mesons from beauty-hadron decays) in $|y|< 0.5$ in pp collisions at $\sqrts =5.02 \tev$, from the analysis without decay-vertex reconstruction, compared to FONLL pQCD calculations with the $\mathrm{B} \rightarrow \mathrm{D} + X$ decay kinematics from the EvtGen package (grey boxes). The contributions of prompt $\Dzero$ from FONLL (red) and $\Dzero$ from B-meson decays from FONLL+EvtGen (blue) are also shown separately. The vertical error bars and the empty boxes represent the statistical and systematic uncertainties, respectively. |  |
Figure 15
Ratios of $\Dzero$-meson production cross section per unit of rapidity at mid-rapidity ($|y|< 0.5$) to those measured by the LHCb Collaboration in three rapidity ranges, $2< y< 2.5$ (left panel), $3< y< 3.5$ (middle panel), and $4< y< 4.5$ (right panel), as a function of $\pt$. The error bars and boxes represent the statistical and systematic uncertainty, respectively Predictions from FONLL calculations are compared to the data points. | 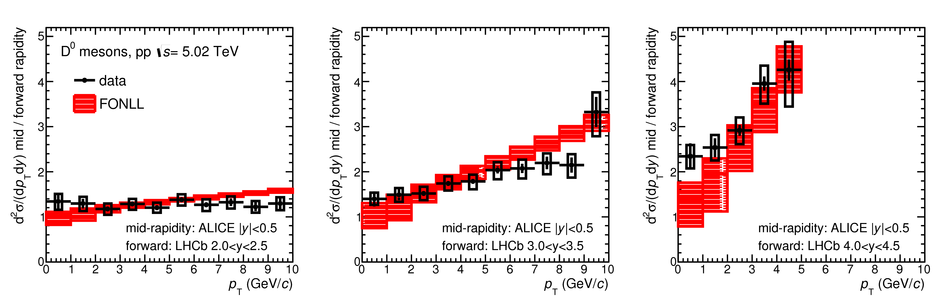 |