Left plots show the distributions of residuals for the set of three jet shapes in a given interval of $p_{\rm{T,jet}}^{\rm{part,ch}}$ $40$--$60$ GeV/$c$ using the PYTHIA and PYTHIA embedded simulations. Right plots show the width (quantified as the standard deviation) of the distributions on the left as a function of the values of the shapes at particle level. The black and red curvescorrespond to pp and Pb--Pb simulations, respectively. The line connecting the points on the right is drawn to guide the eye. | 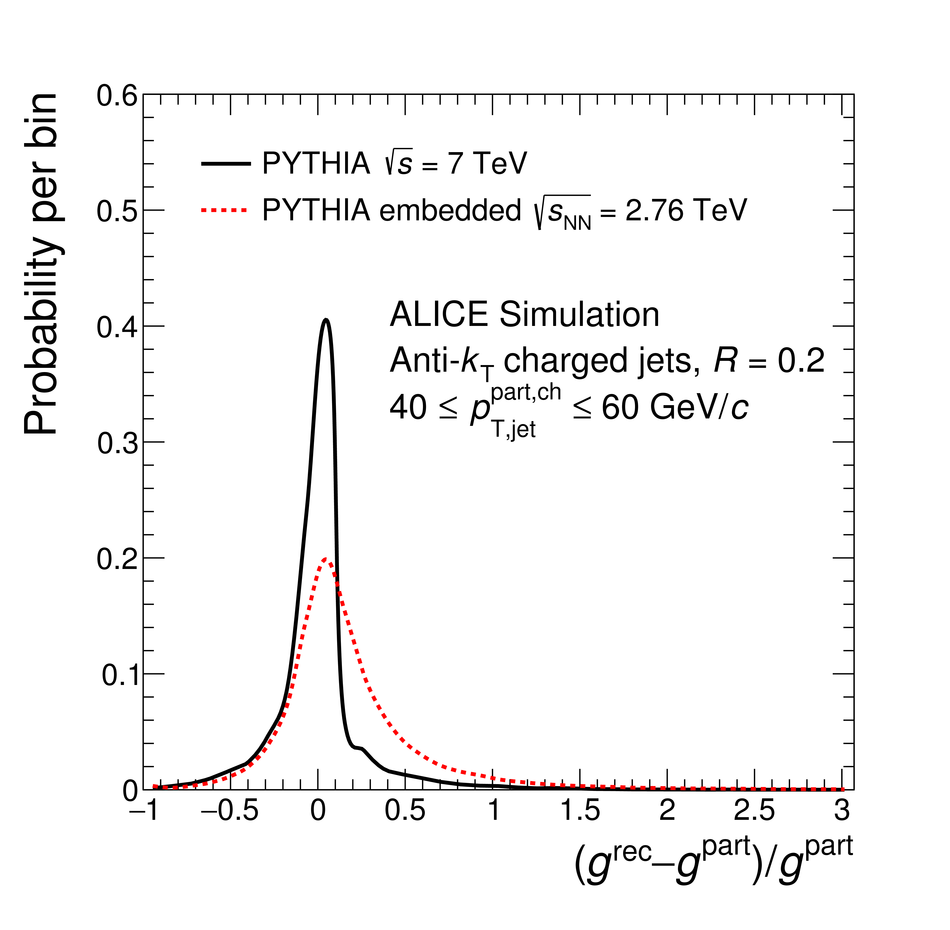 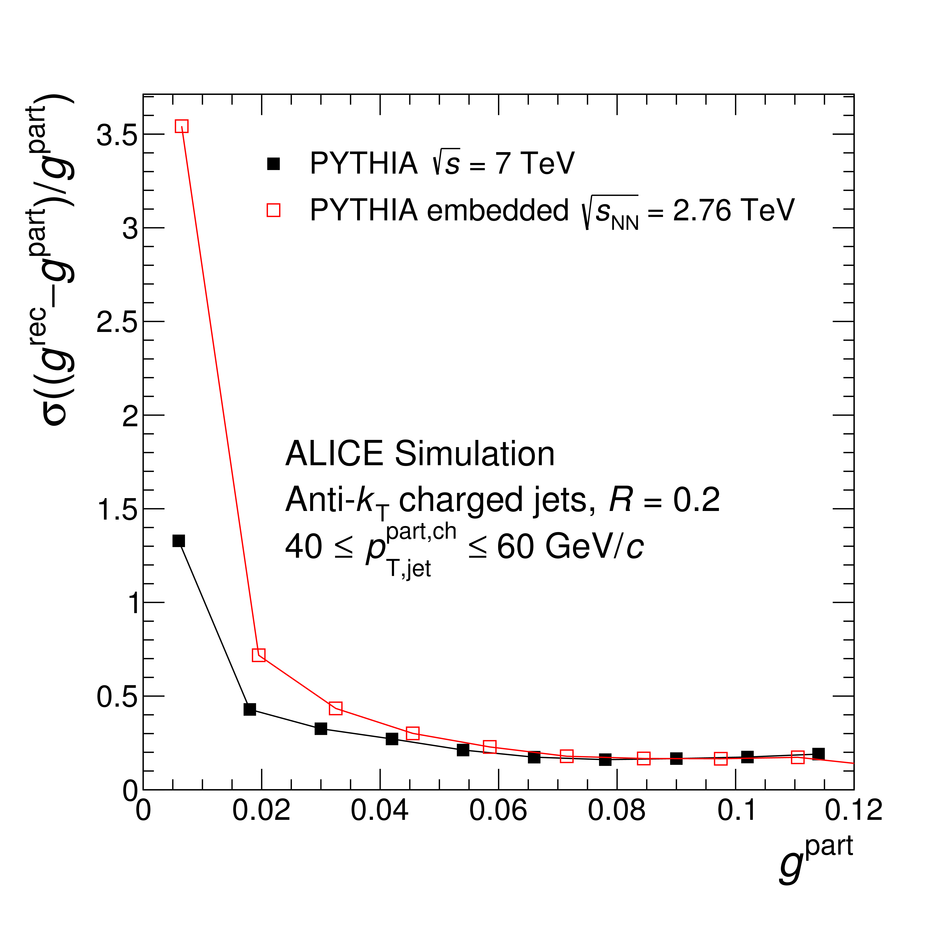 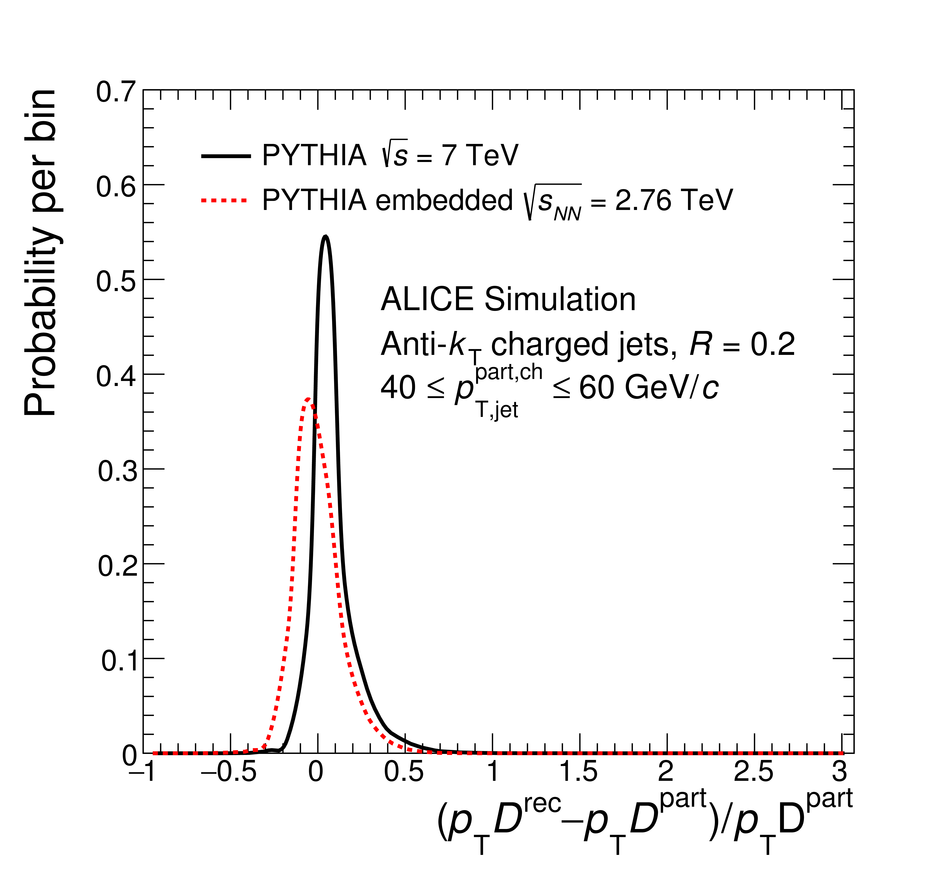 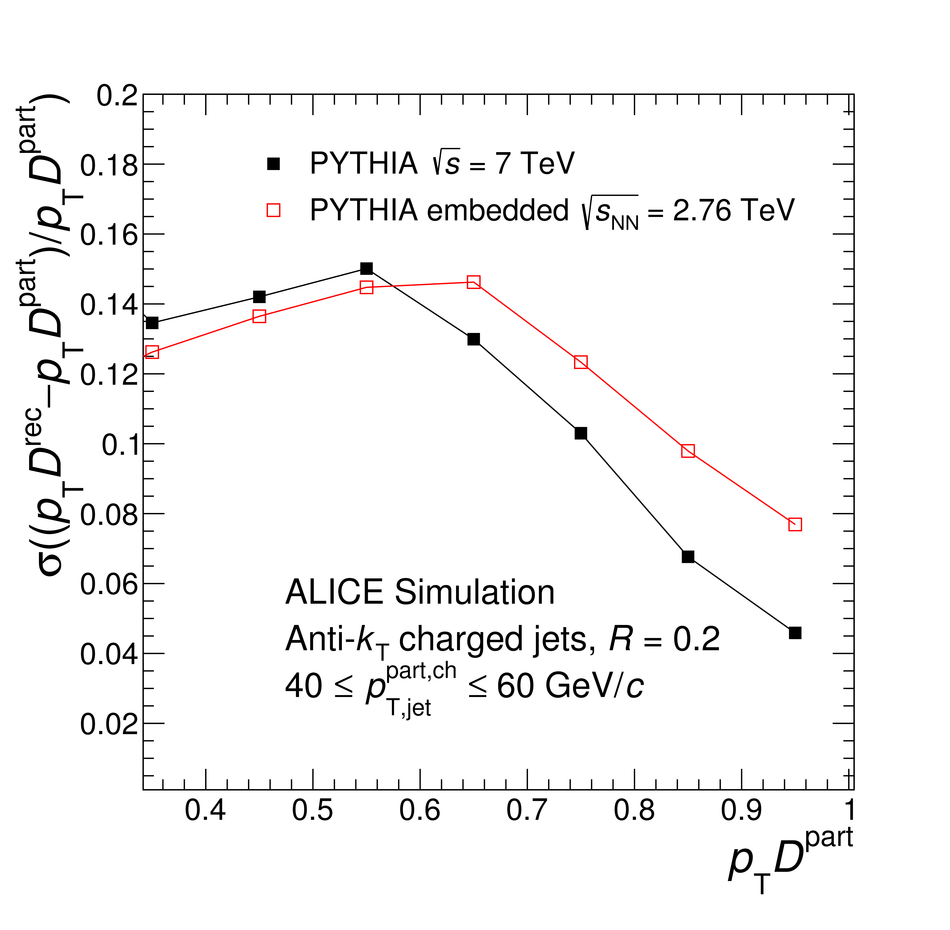 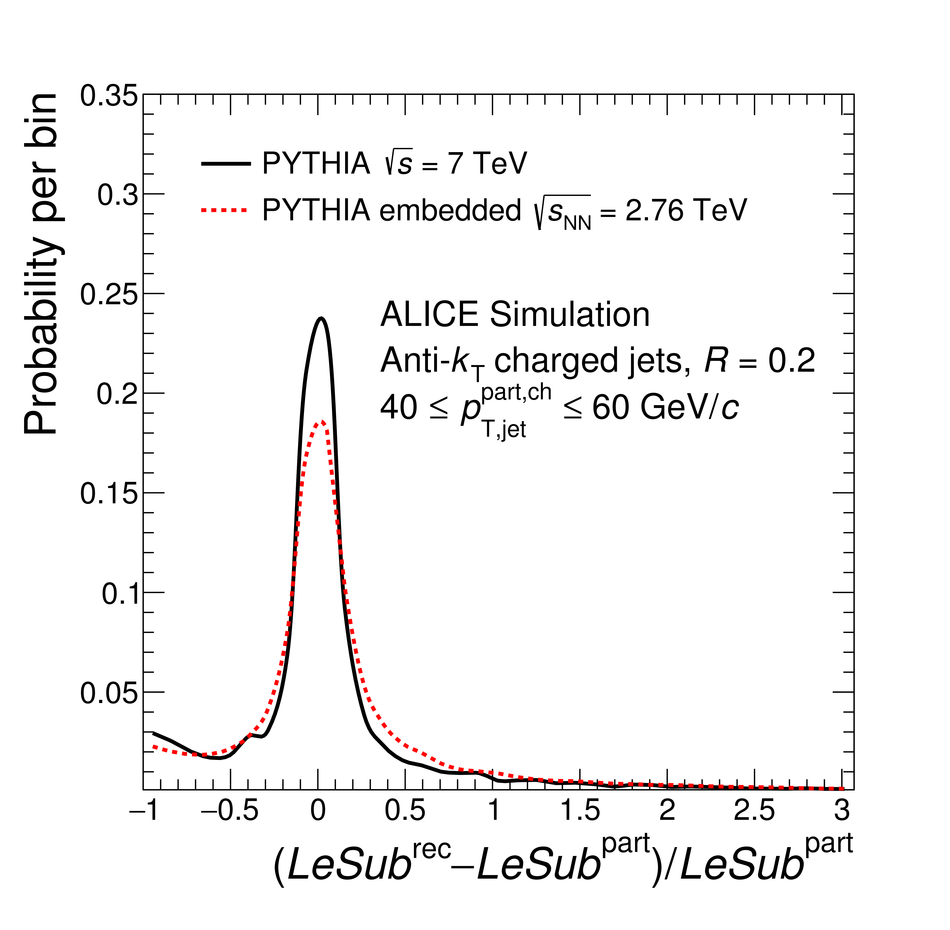 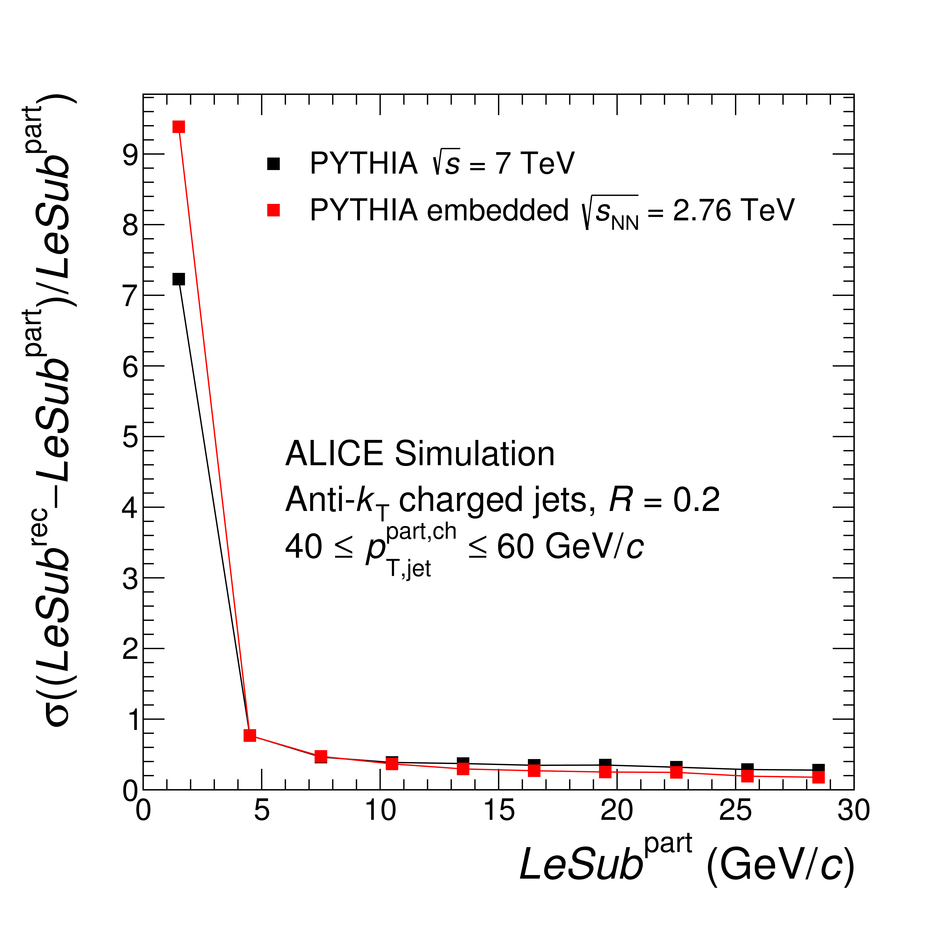 |