Average $\RAA$ of prompt $\Dzero$, $\Dplus$ and $\Dstar$ mesons in the 0--10\% (left), 30--50\% (middle) and 60--80\% (right) centrality classes at $\sqrtsNN=5.02 \tev$ compared to the $\RAA$ of charged particles in the same centrality classes . The ratios of the $\RAA$ are shown in the bottom panels. Statistical (bars), systematic (empty boxes), and normalisation (shaded box around unity) uncertainties are shown. | 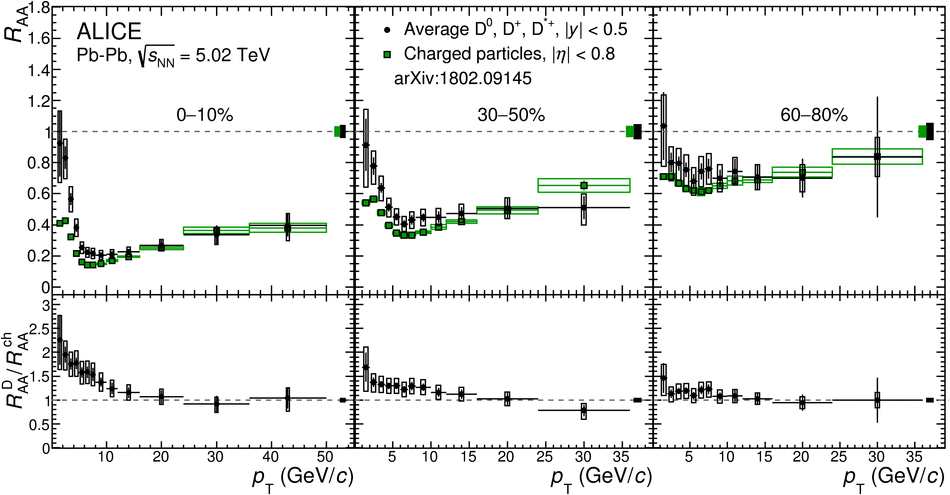 |