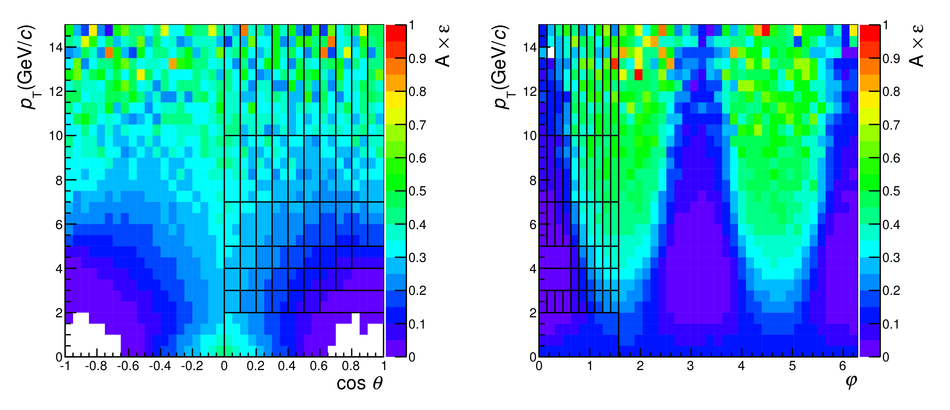
($A$$\times$$\epsilon$) 2-D maps in the planes ($\cos\theta$, $p_{\rm T}$) (left) and ($\varphi$, $p_{\rm T}$) (right) in the Collins-Soper frame. The plots illustrate the symmetry with respect to $\cos\theta = 0$ (left) and with respect to $\varphi = \pi$ and $\pi/2$ (right), while the grid shows the binning used to build the $W_1(\cos\theta)$ and $W_2(\varphi)$ distributions in each $p_{\rm T}$ range. |  |