Top panel: comparison between the $\phi$ yield as a function of $\pt$ with the EPOS 3.101 and HIJING 2.0 event generators, at forward and midrapidity , for 0-40\% (left) and 40-90\% centrality (right). The same scale factors applied to data were also used for the models. The transparent boxes represent the uncorrelated systematic uncertainties at forward rapidity and the total systematic uncertainties (including correlated and uncorrelated components) at midrapidity. Lower panels: ratios between the measured yields and the calculations by EPOS and HIJING. | 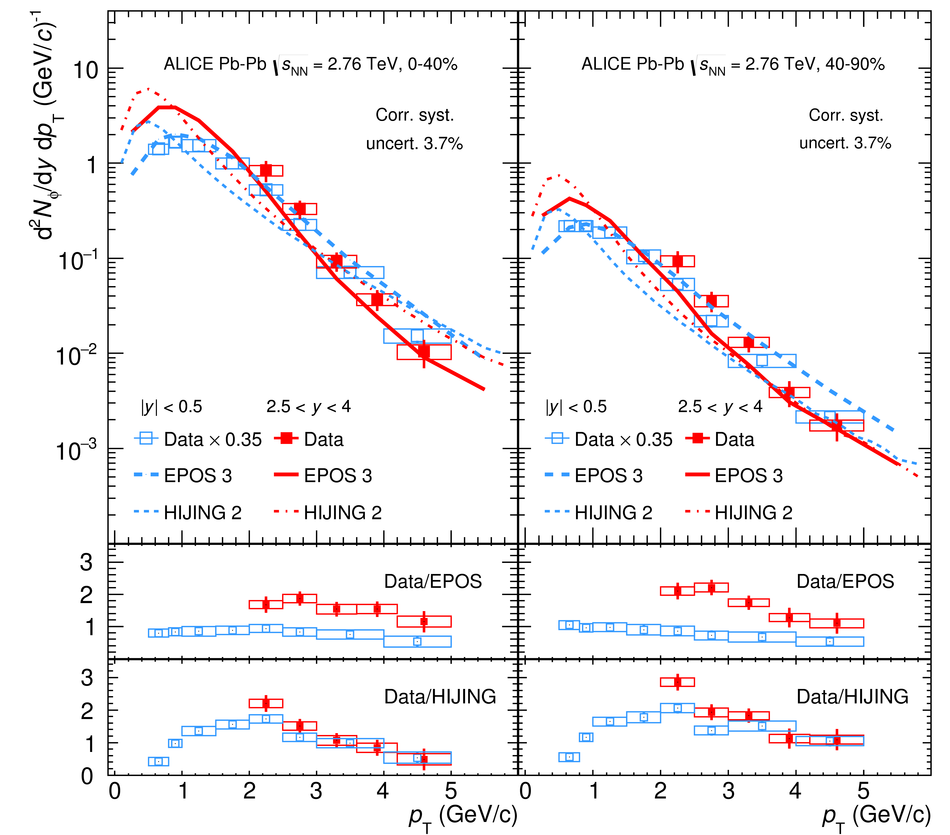 |