The diphoton invariant mass distributions around the \pai mass for selected intervals in \pT, without and withcombinatorial background for each of the five measurements: PHOS, EMC, PCM, PCM-$\gamma^{*}\gamma$, and PCM-EMC. The vertical lines correspond to the limits of the region used to compute the integration of the meson signal. | 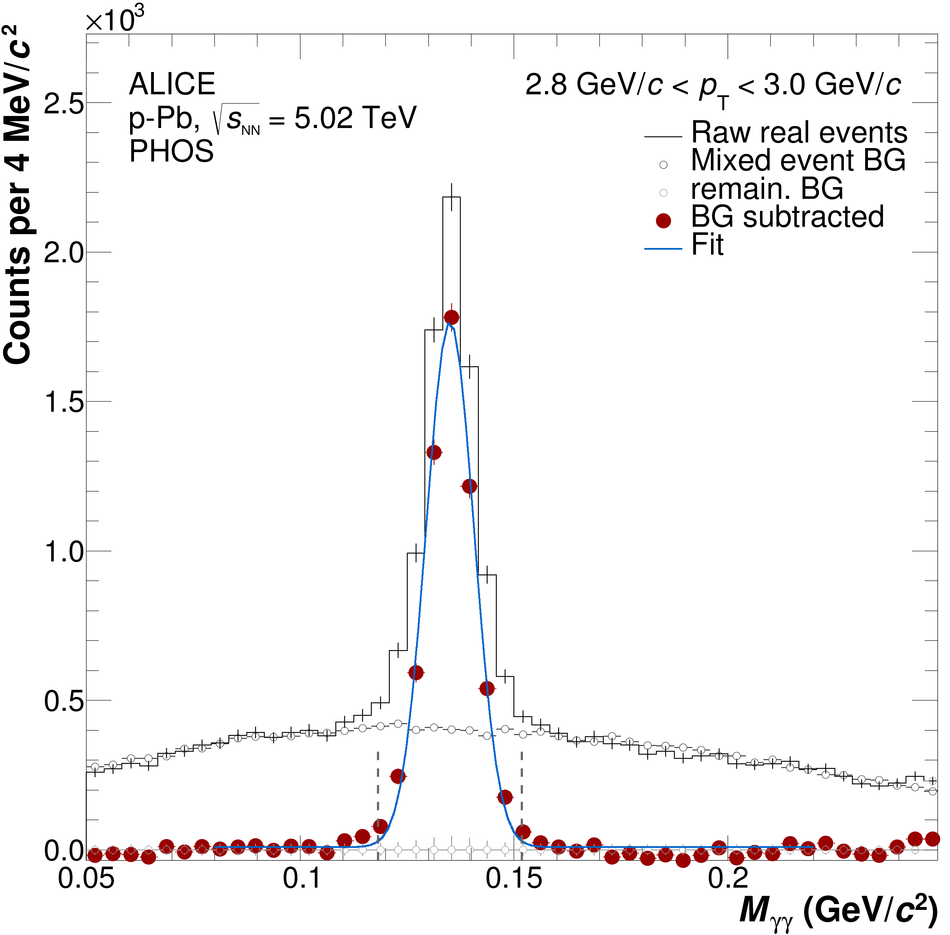 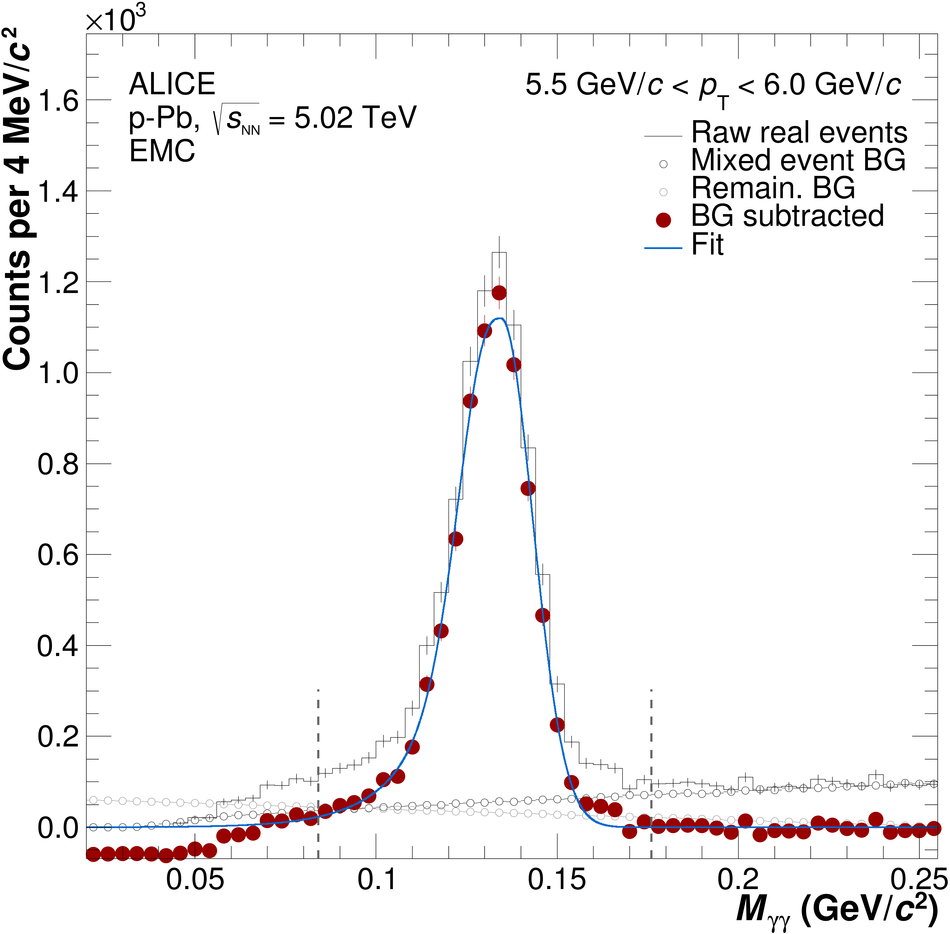 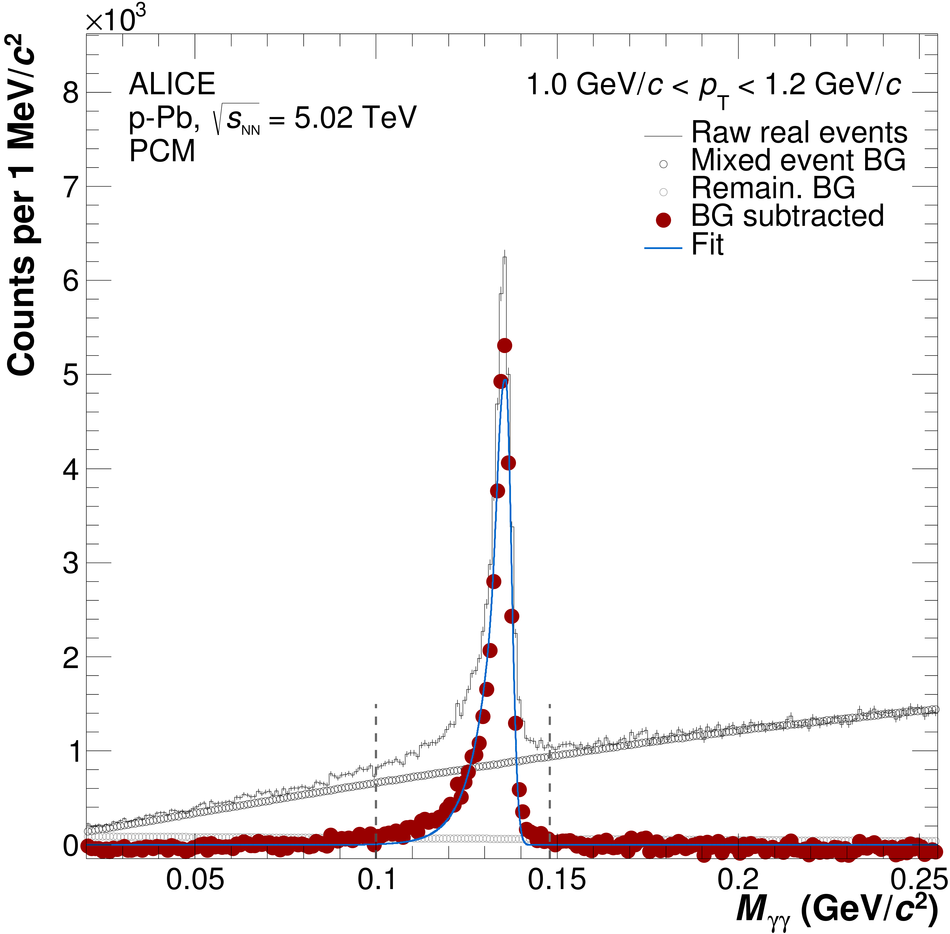   |