Summed $\pT$ in Toward (top), Transverse (middle) and Away (bottom) regions at $\sqrt{s}=0.9$ TeV (left) and $\sqrt{s}=7$ TeV (right). Right and left vertical scales differ by a factor 4 (2) in the top (middle and bottom) panel. Shaded area in upper plots: systematic uncertainties. Shaded areas in bottom plots: sum in quadrature of statistical and systematic uncertainties. Horizontal error bars: bin width. | 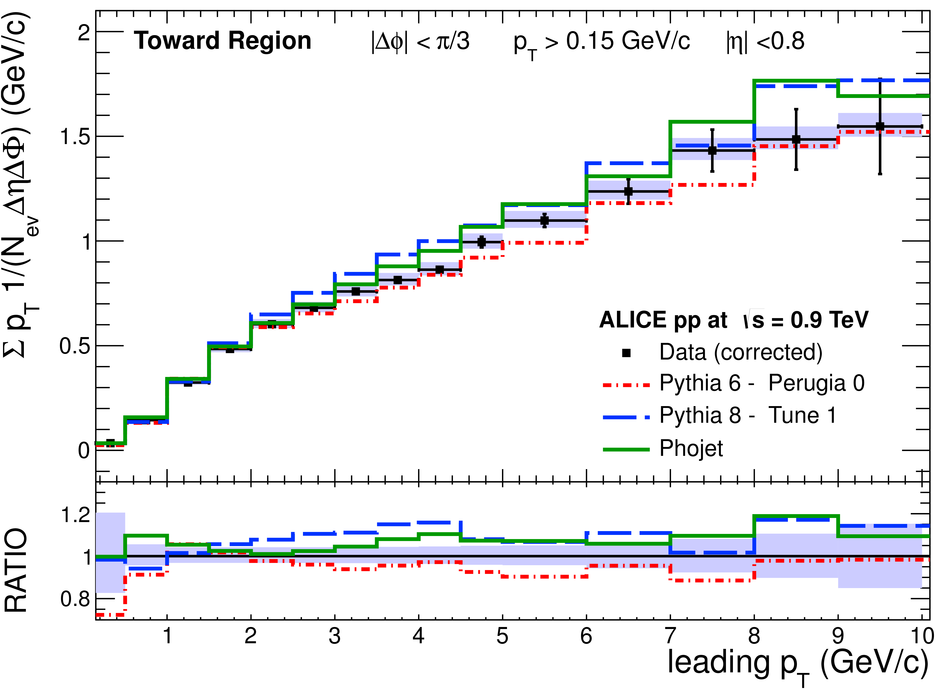  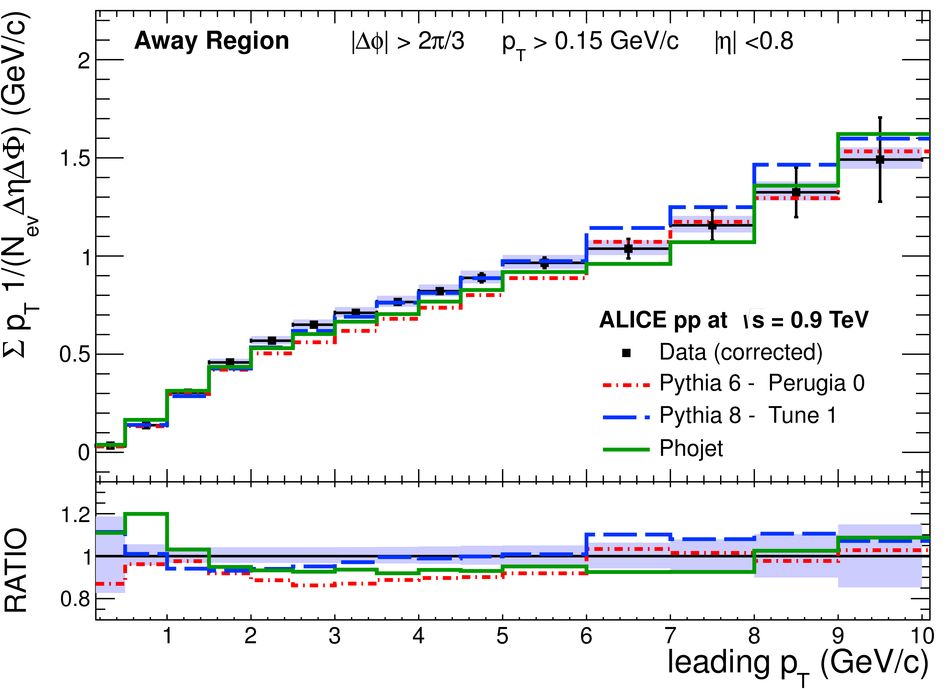 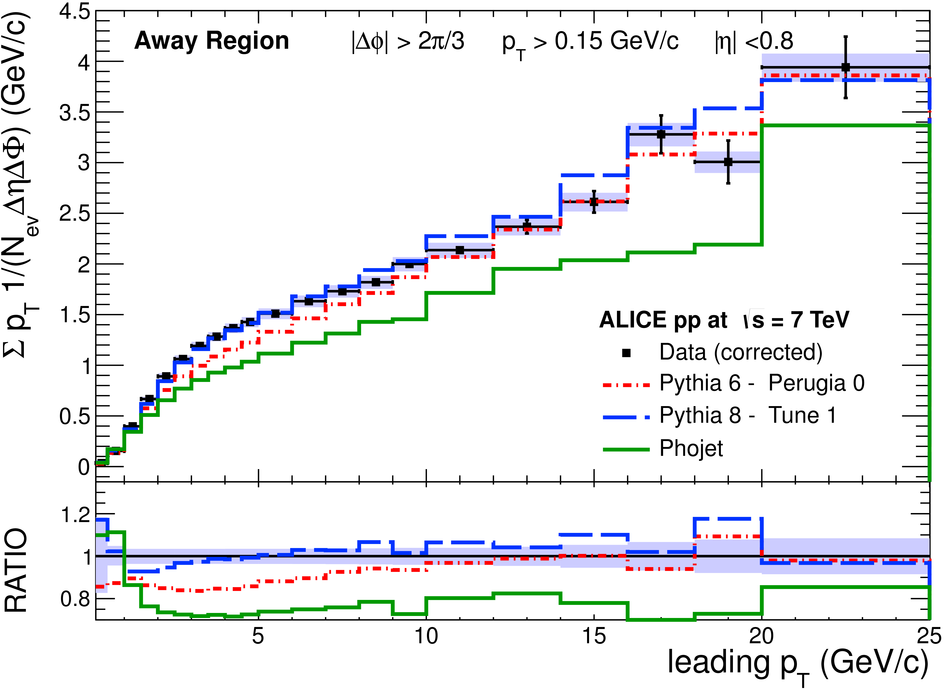 |
![[png]](https://alice-publications.web.cern.ch/sites/default/files/papers/3099/sumpt_transv-89320.png)
![[png]](https://alice-publications.web.cern.ch/sites/default/files/papers/3099/sumpt_transv_0-89322.png)