Comparison of number density in the plateau of the Transverse region (see Table \ref{enscaling_tab}) and $dN_{\rm ch}/d\eta$ in minimum-bias events (scaled by $1/2\pi$) . Both are for charged particles with $\pT >\unit[0.5]{\gmom}$. For this plot, statistical and systematic uncertainties have been summed in quadrature. The lines show fits with the functional form $a+b\ln{s}$. | 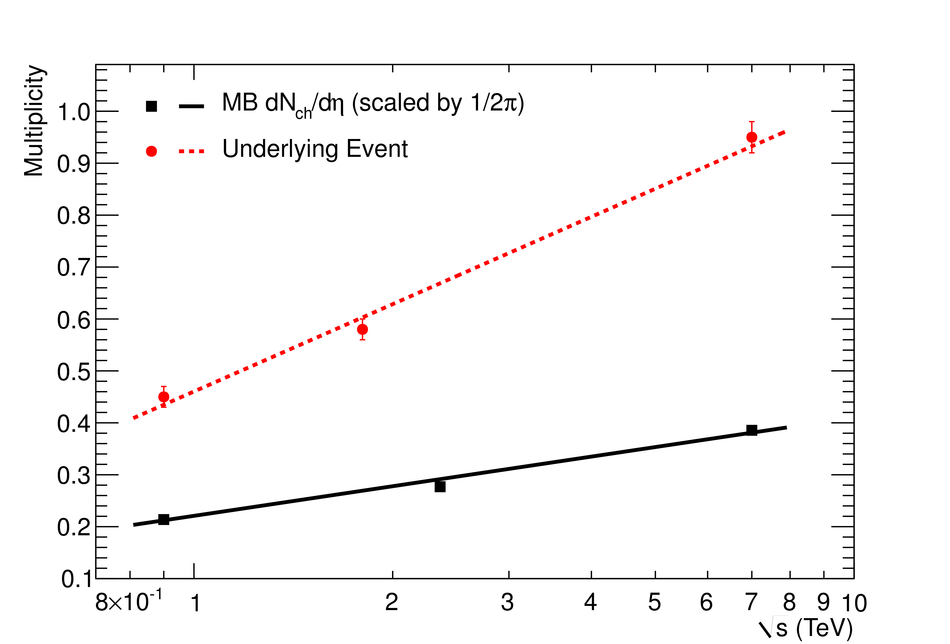 |