The production yield of prompt D mesons and their elliptic flow coefficient $v_2$ were measured with the Event-Shape Engineering (ESE) technique applied to mid-central (10-30% and 30-50% centrality classes) Pb-Pb collisions at the centre-of-mass energy per nucleon pair $\sqrt{s_{\rm NN}} =5.02$ TeV, with the ALICE detector at the LHC. The ESE technique allows the classification of events, belonging to the same centrality, according to the azimuthal anisotropy of soft particle production in the collision. The reported measurements give the opportunity to investigate the dynamics of charm quarks in the Quark-Gluon Plasma and provide information on their participation in the collective expansion of the medium. D mesons were reconstructed via their hadronic decays at mid-rapidity, $|\eta|<~0.8$, in the transverse momentum interval $1<~p_{\rm T}<~24$ GeV/$c$. The $v_2$ coefficient is found to be sensitive to the event-shape selection confirming a correlation between the D-meson azimuthal anisotropy and the collective expansion of the bulk matter, while the per-event D-meson yields do not show any significant modification within the current uncertainties.
JHEP 02 (2019) 150
HEP Data
e-Print: arXiv:1809.09371 | PDF | inSPIRE
CERN-EP-2018-260
Figure 1
Left: distribution of $\qTPC$ (see text for details) as a function of centrality in $\PbPb$ collisions at $\sqrtsNN=5.02 \TeV$. The red long-dashed and the blue short-dashed lines represent the limits for the 20\% and the 60\% of events with largest and smallest $\qTPC$, respectively. Right: $\qTPC$ distributions for the unbiased, small-$\qTPC$ and large-$\qTPC$ samples for the 30--50\% centrality class (see text for details). | 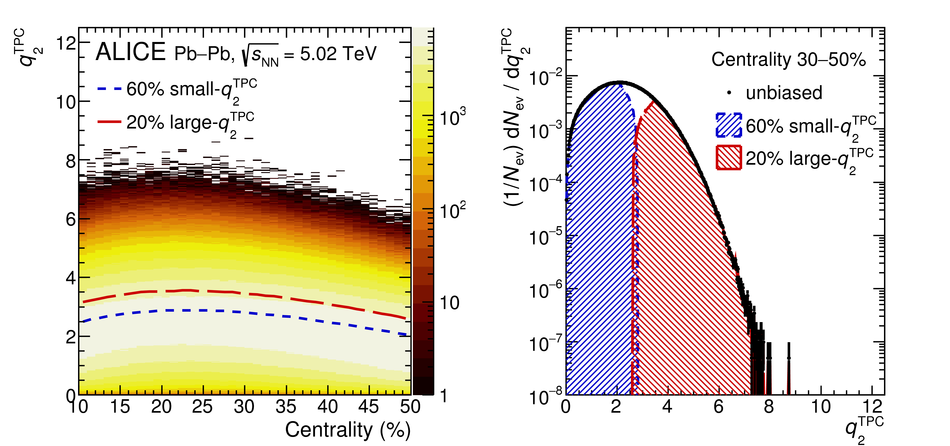 |
Figure 2
Invariant-mass distributions of $\Dzero$ candidates (left panel), $\Dplus$ candidates (middle panel) and mass-difference for $\Dstar$ candidates (right panel) in three $\pt$ intervals for the two $\Delta\varphi$ regions used in the EP method for $\PbPb$ collisions in the 10--30\% centrality class at $\sqrtsNN=5.02 \TeV$. The solid curves represent the total fit functions and the dotted curves the background functions, as described in the text. | 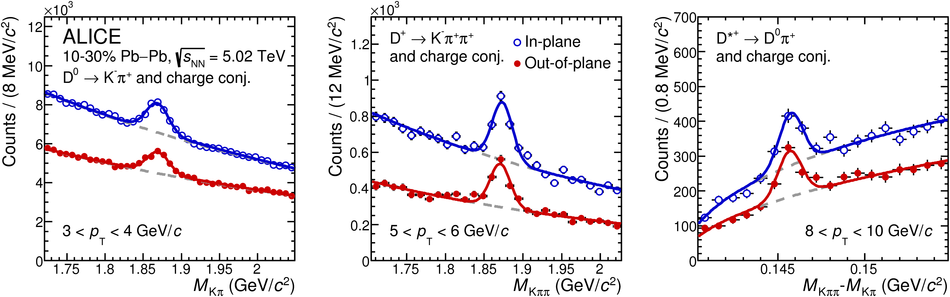 |
Figure 3
Invariant-mass distributions of $\Dzero$ candidates (left column) and $\Dplus$ candidates (right column) in two $\pt$ intervals for the two $\Delta\varphi$ regions used in the EP method for the 30--50\% $\PbPb$ collisions at $\sqrtsNN=5.02 \TeV$. The top row shows the distributions for the small-$\qTPC$ sample, while the bottom row for the large-$\qTPC$ sample (see text for details). The solid curves represent the total fit functions and the dotted curves the background functions, as described in the text. | 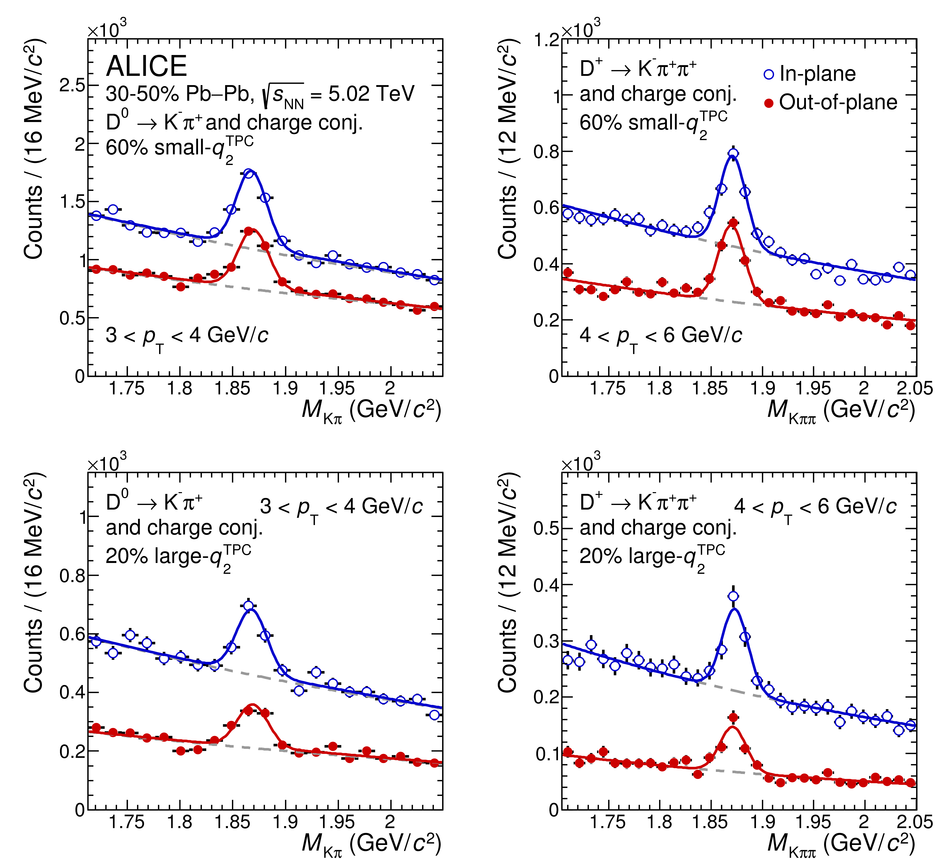 |
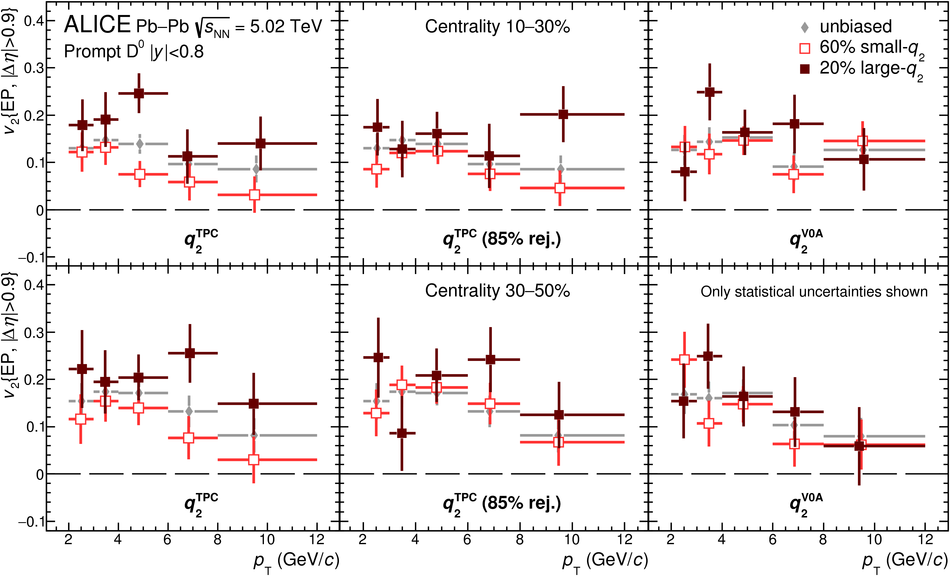
Figure 5
Elliptic flow coefficient $v_2$ as a function of $\pt$ for prompt $\Dzero$, $\Dplus$, and $\Dstar$ mesons for $\PbPb$ collisions at $\sqrtsNN=5.02 \TeV$ in the centrality class 10--30\%. The symbols are positioned horizontally at the average $\pt$ of the reconstructed D mesons. Vertical error bars represent the statistical uncertainty, empty boxes the systematic uncertainty associated with the D-meson anisotropy measurement and the event-plane resolution. Shaded boxes show the uncertainty due to the feed-down from beauty-hadron decays. | 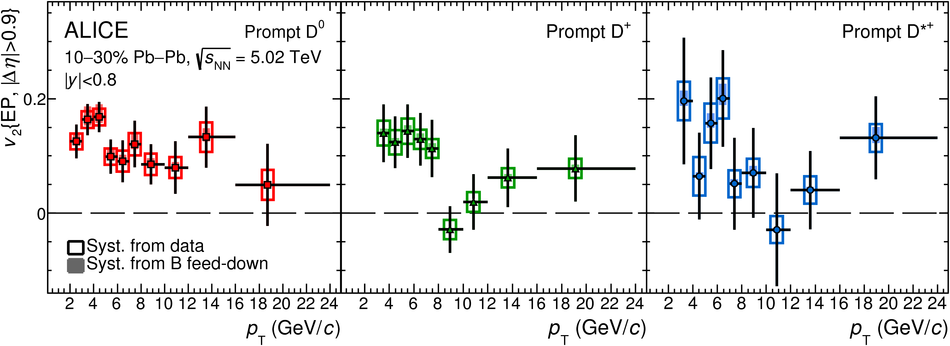 |
Figure 6
Average $\Dzero$, $\Dplus$, $\Dstar$ $v_2$ as a function of $\pt$ for $\PbPb$ collisions at $\sqrtsNN=5.02 \TeV$ in the centrality classes 10--30\% (left) and 30--50\% (right). The comparison with the measurement of the $\Dzero$ $v_2$ by the CMS Collaboration and the charged pion $v_2$ in the same centrality intervals is also shown. | 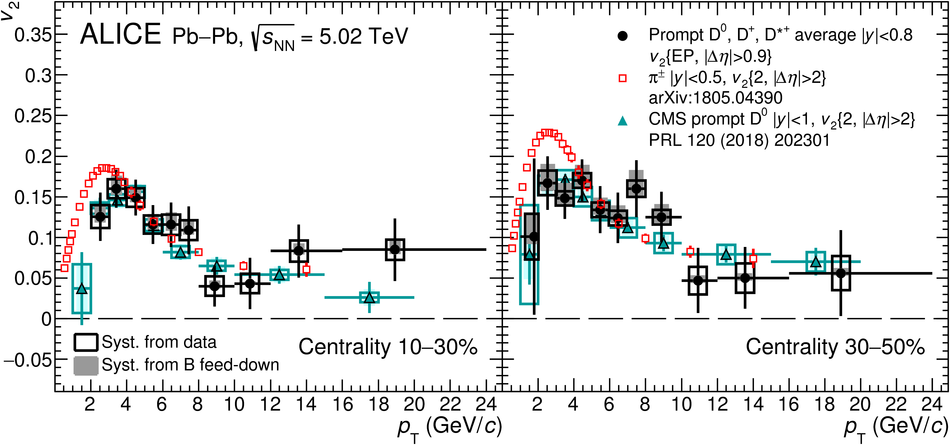 |
Figure 7
$\Dzero$ (left column) and $\Dplus$ (right column) $v_2$ as a function of $\pt$ for the small-$\qTPC$ and large-$\qTPC$ samples (see text for details), in $\PbPb$ collisions at $\sqrtsNN=5.02 \TeV$ in the 10--30\% (top row) and 30--50\% (bottom row) centrality classes. The symbols are positioned horizontally at the average $\pt$ of the reconstructed D mesons. Vertical error bars represent the statistical uncertainty, empty boxes the systematic uncertainty associated with the D-meson anisotropy measurement and the event-plane resolution. Shaded boxes show the uncertainty due to feed-down from beauty-hadron decays. | 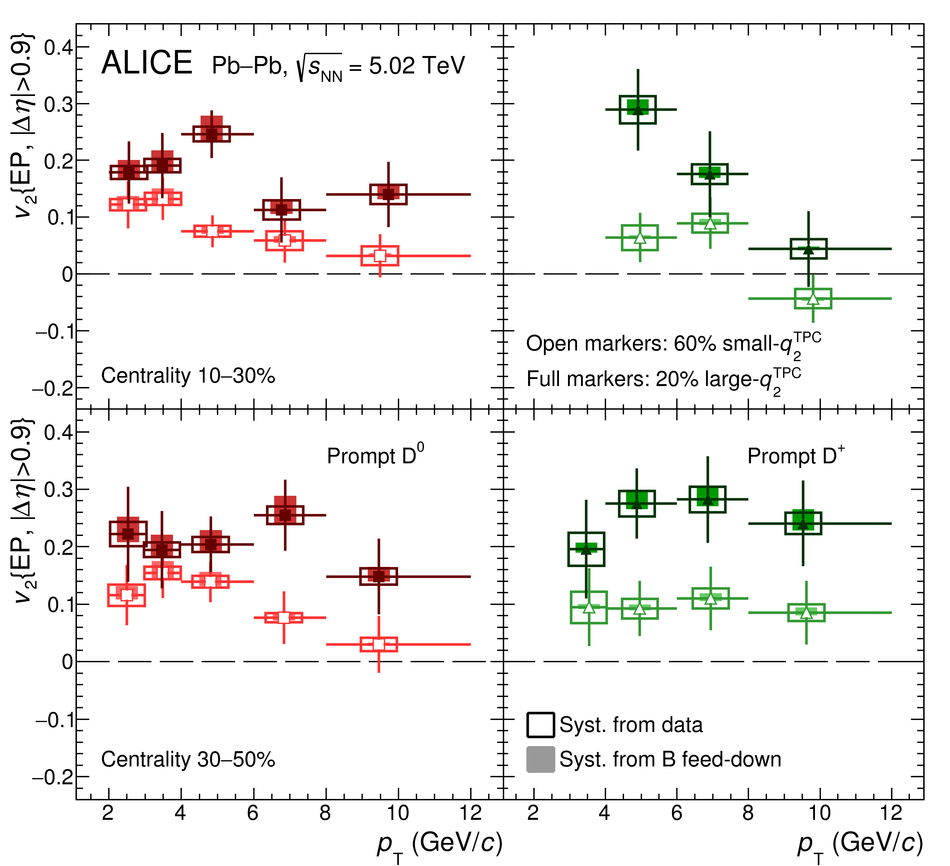 |
Figure 8
Top panels: average of $\Dzero$ and $\Dplus$ $v_2$ as a function of $\pt$ for $\PbPb$ collisions at $\sqrtsNN=5.02 \TeV$ in the small-$\qTPC$, large-$\qTPC$ (see text for details) and unbiased samples, in the 10--30\% (left) and 30--50\% (right) centrality classes. Bottom panels: ratios of the measured $v_2$ in the ESE-selected classes to the one obtained from the unbiased sample. | 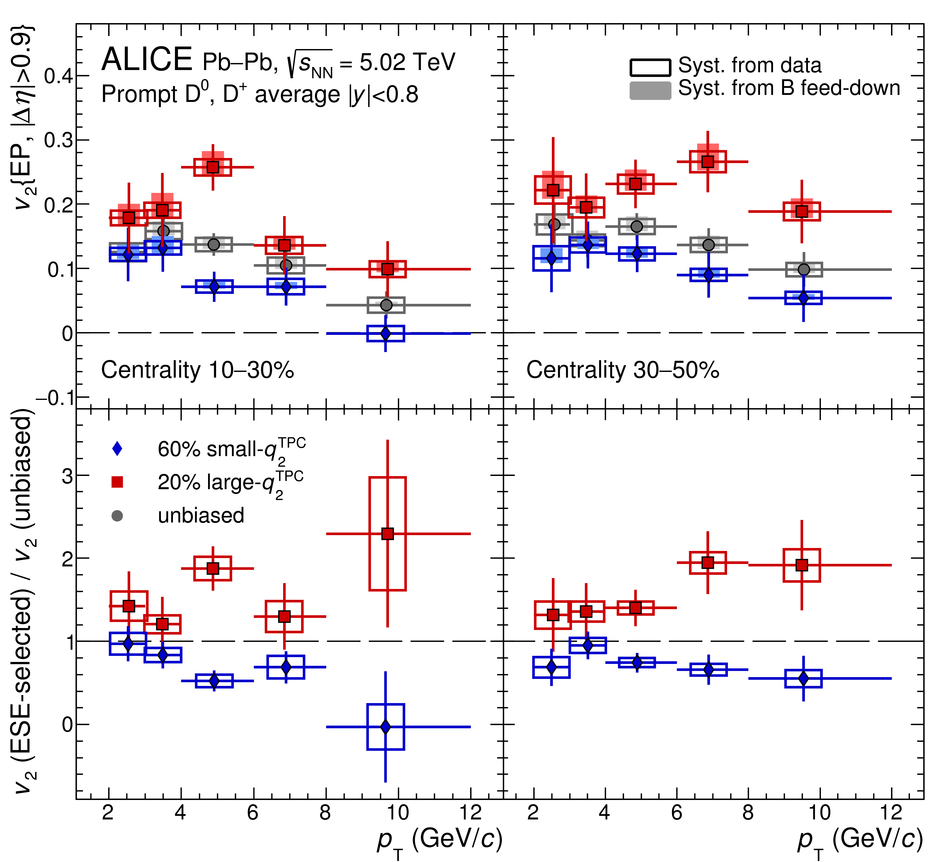 |
Figure 9
Top panels: average of $\Dzero$ and $\Dplus$ $v_2$ as a function of $\pt$ for $\PbPb$ collisions at $\sqrtsNN=5.02 \TeV$ in the small-$\qVZEROA$, large-$\qVZEROA$ (see text for details) and unbiased samples, in the 10--30\% (left) and 30--50\% (right) centrality classes. The charged-particle $v_2$ obtained at the same energy, centrality classes and ESE samples are superimposed for comparison. Bottom panels: ratios of the measured $v_2$ in the ESE-selected classes to the one obtained from the unbiased sample. | 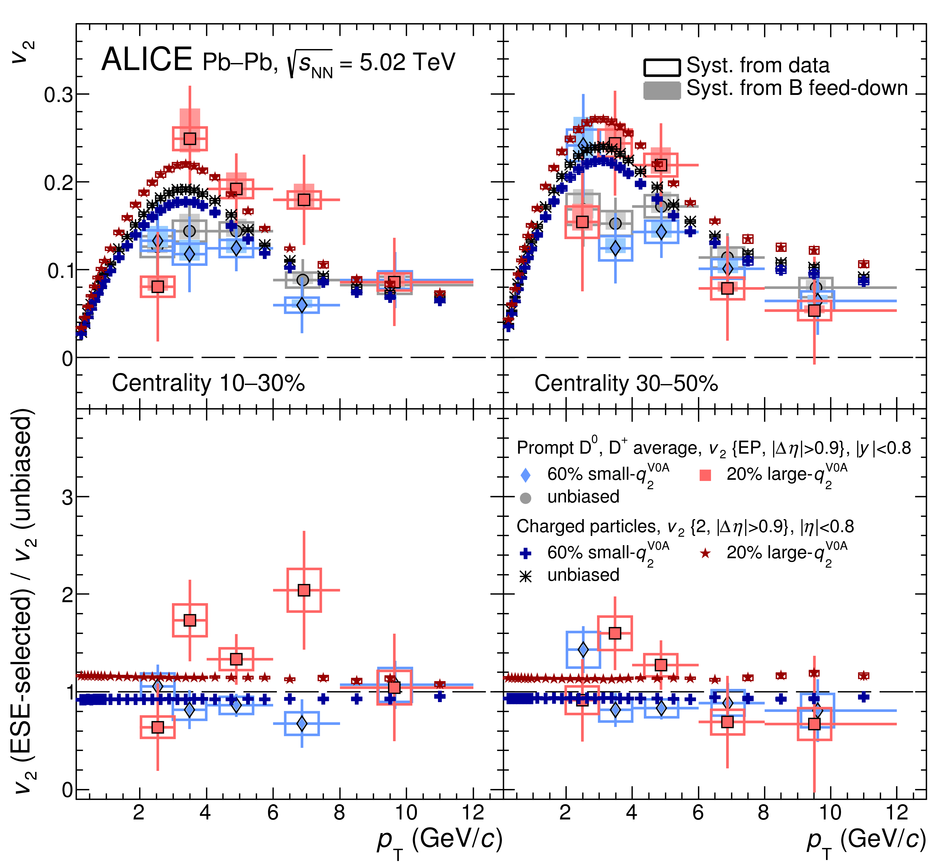 |
Figure 10
Ratio of the yields of $\Dzero$ and $\Dplus$ mesons measured as a function of $\pt$ in the small-$\qTPC$ (left column) and large-$\qTPC$ (right column) samples (see text for details) to that in the unbiased sample, in $\PbPb$ collisions at $\sqrtsNN=5.02 \TeV$ for the 10--30\% (top row) and 30--50\% (bottom row) centrality classes. Vertical error bars represent the statistical uncertainty, empty boxes the total systematic uncertainty. | 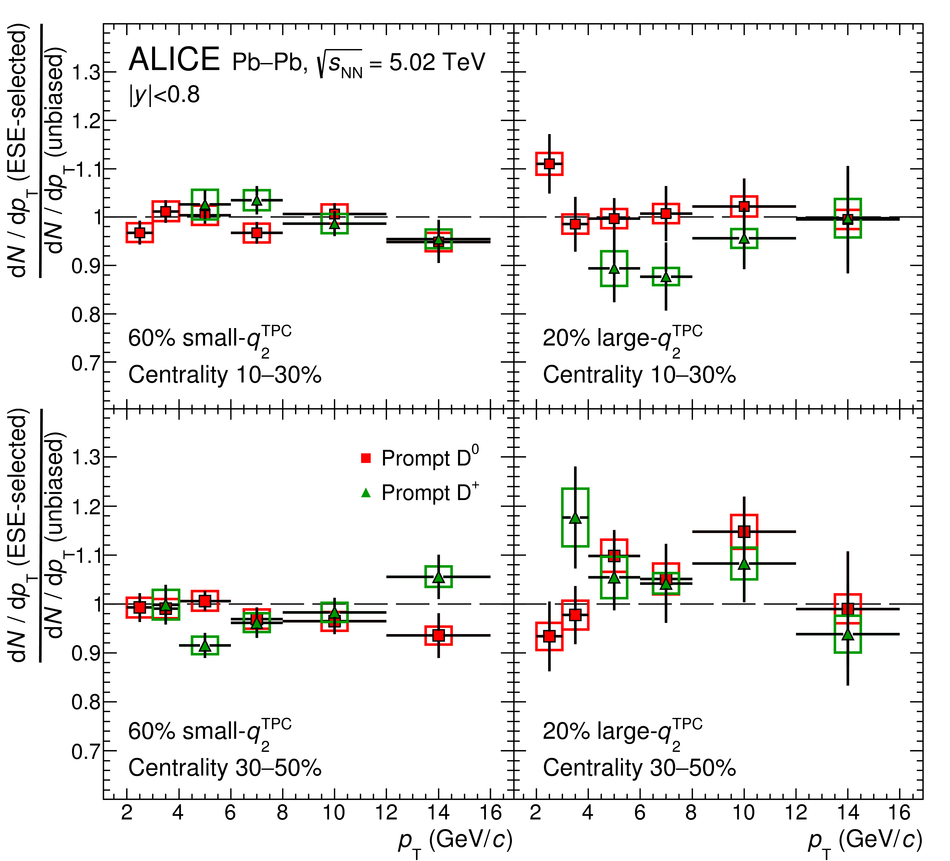 |
Figure 11
Average of the ratio of $\Dzero$ and $\Dplus$ yields measured as a function of $\pt$ in the ESE-selected samples to those in the unbiased sample, in $\PbPb$ collisions at $\sqrtsNN=5.02 \TeV$ for the 10--30\% (left panel) and 30--50\% (right panel) centrality classes. Vertical error bars represent the statistical uncertainty, empty boxes the total systematic uncertainty. | 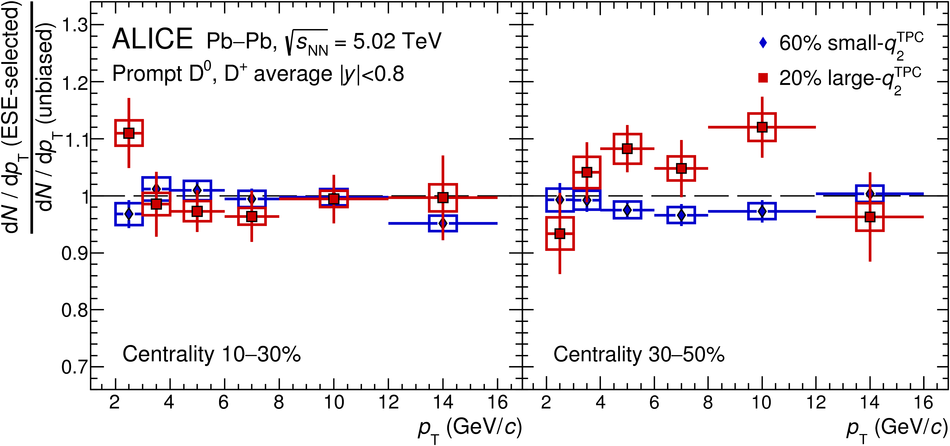 |