We report the differential charged jet cross section and jet fragmentation distributions measured with the ALICE detector in proton-proton collisions at a centre-of-mass energy $\sqrt{s}=$ 7 TeV. Jets with pseudo-rapidity $\left| \eta \right| <~ {\rm 0.5}$ are reconstructed from charged particles using the anti-$k_{\rm T}$ jet finding algorithm with a resolution parameter $R$ = 0.4. The jet cross section is measured in the transverse momentum interval 5 $\leq p_{\rm T}^{\rm ch \; jet} <~$ 100 GeV/$c$. Jet fragmentation is studied measuring the scaled transverse momentum spectra of the charged constituents of jets in four intervals of jet transverse momentum between 5 GeV/$c$ and 30 GeV/$c$. The measurements are compared to calculations from the PYTHIA model as well as next-to-leading order perturbative QCD calculations with POWHEG + PYTHIA8. The charged jet cross section is described by POWHEG for the entire measured range of $p_{\rm T}^{\rm ch \; jet}$. For $p_{\rm T}^{\rm ch \; jet}$ $>$ 40 GeV/$c$, the PYTHIA calculations also agree with the measured charged jet cross section. PYTHIA6 simulations describe the fragmentation distributions to 15%. Larger discrepancies are observed for PYTHIA8.
Phys. Rev. D 99, 012016
HEP Data
e-Print: arXiv:1809.03232 | PDF | inSPIRE
Figure 1
Top panel: inclusive charged jet cross section in pp collisions at $\rm{\sqrt{s}=7}$ TeV using the anti-$k_{\rm T}$ algorithm with $R$ = 0.4 compared to calculations from PYTHIA6 Perugia-2011 and PYTHIA8 tune Monash. Bottom panel: ratios of MC distributions to data. The shaded band shows the systematic uncertainty on the data drawn at unity, error bars represent the statistical uncertainties Most uncertainties are smaller than the marker size. | 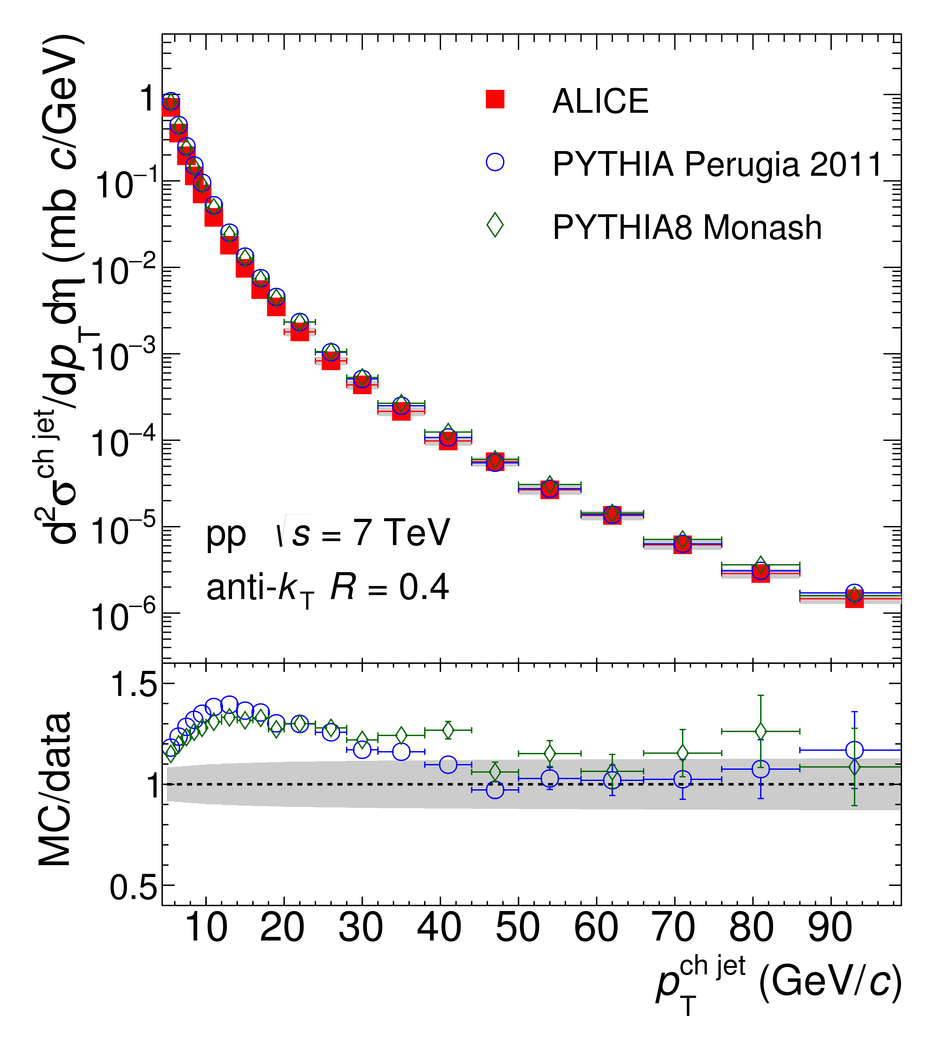 |
Figure 2
Top panel: inclusive charged jet cross section compared to POWHEG + PYTHIA8 NLO pQCD calculations with and without MPI. In data and calculations, the Underlying Event contribution is subtracted. Bottom panel: ratio of POWHEG calculations to data. The shaded bands indicate systematic uncertainties on data and theory predictions. | 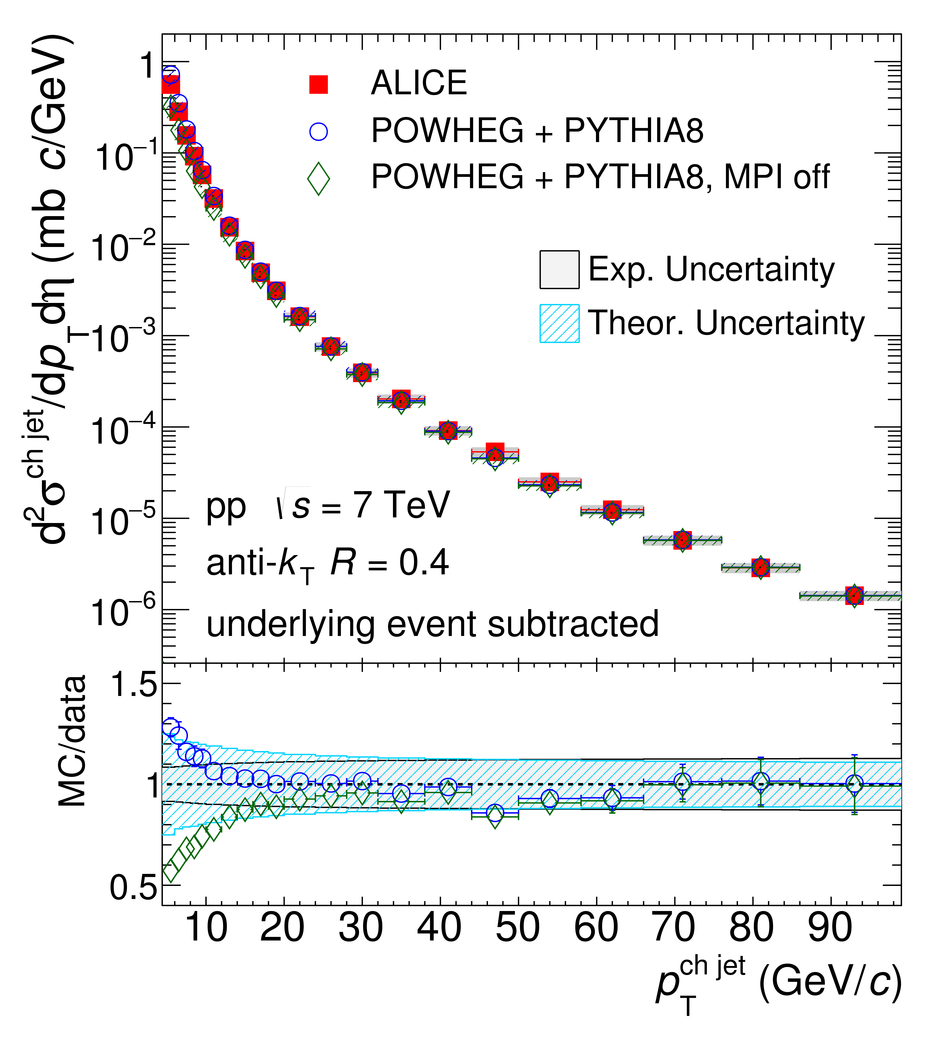 |
Figure 3
Left panel: Charged particle scaled \pt{} spectra $F^{z}(z^{\rm ch},p_{\rm T}^{\rm ch \; jet})$ for different bins in jet transverse momentum. Right panel: Ratio of MC distributions to data. The shaded band shows the systematic uncertainty on the data drawn at unity. Error bars represent the statistical uncertainties. | 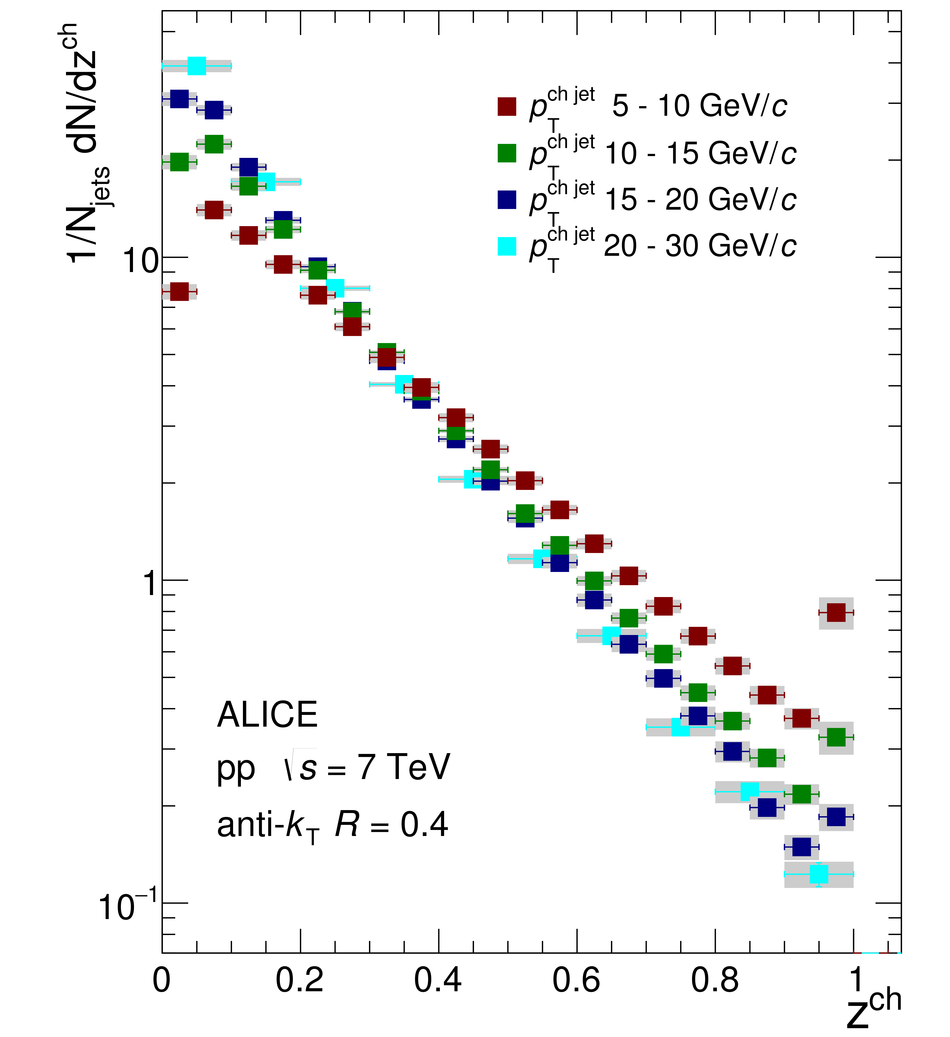 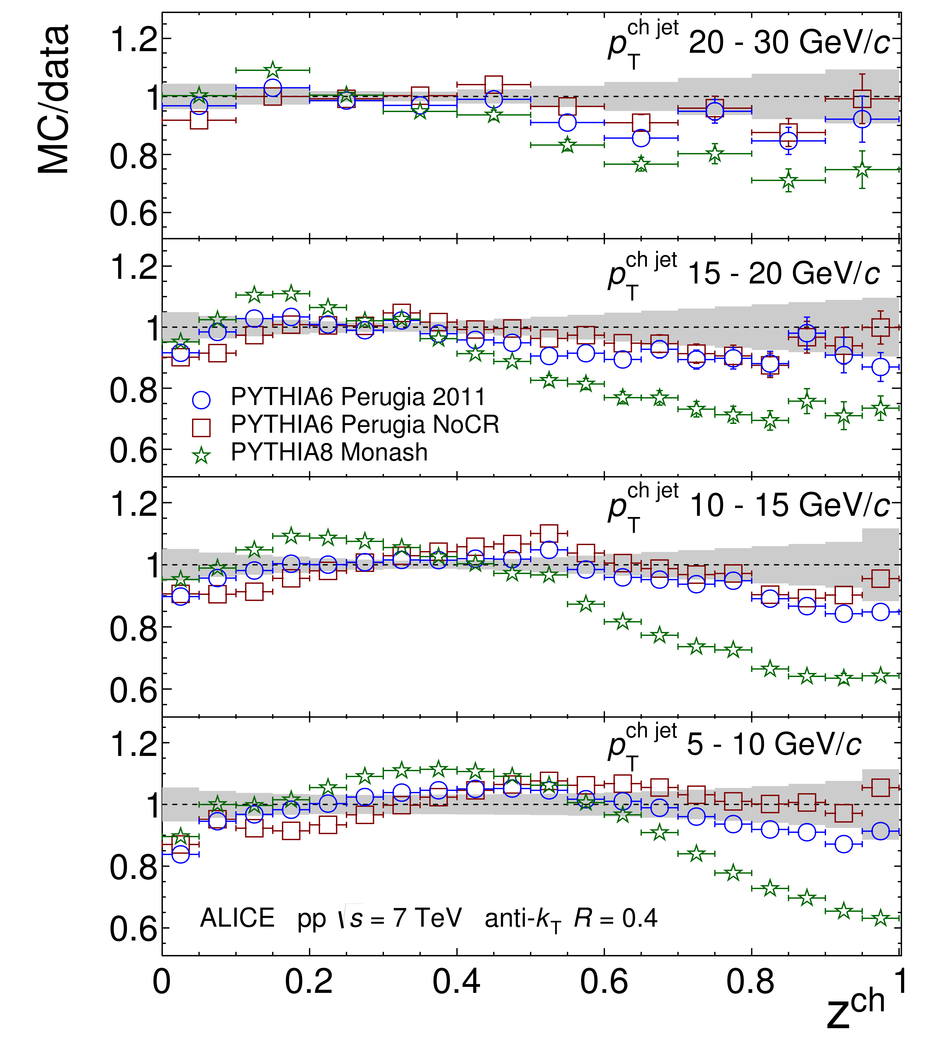 |