Charged-particle pseudorapidity density at mid-rapidity in p-Pb collisions at $\sqrt{s_{\rm{NN}}}$ = 8.16 TeV

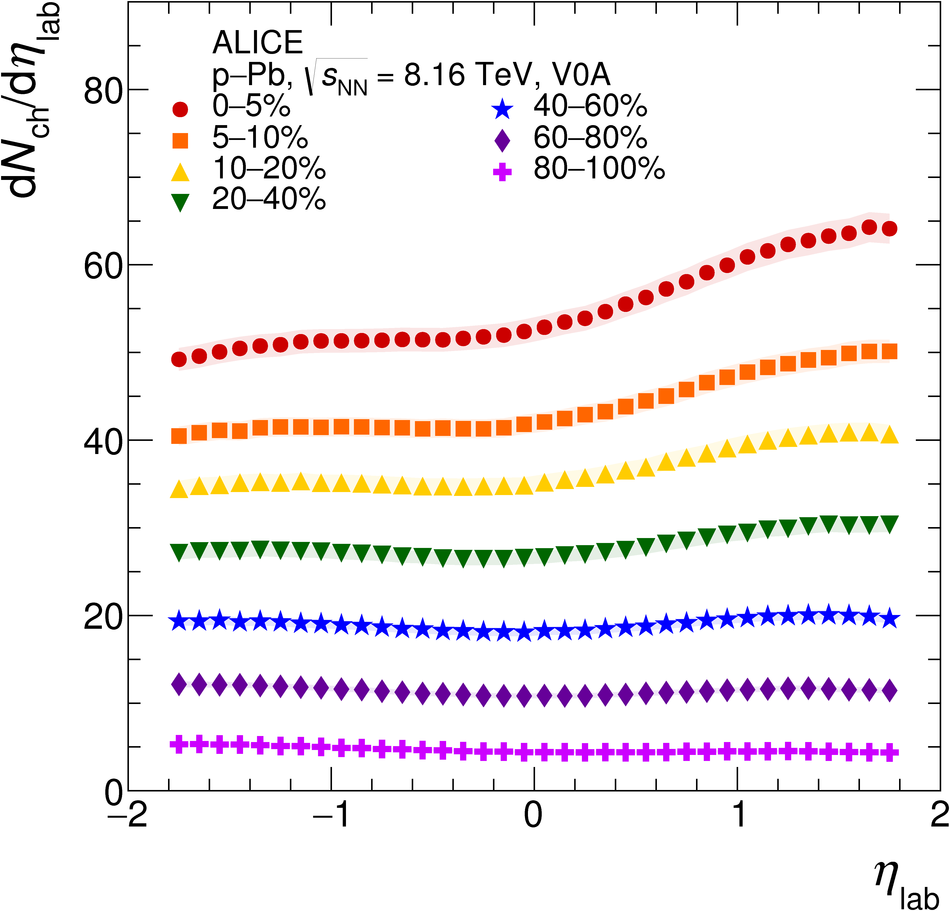
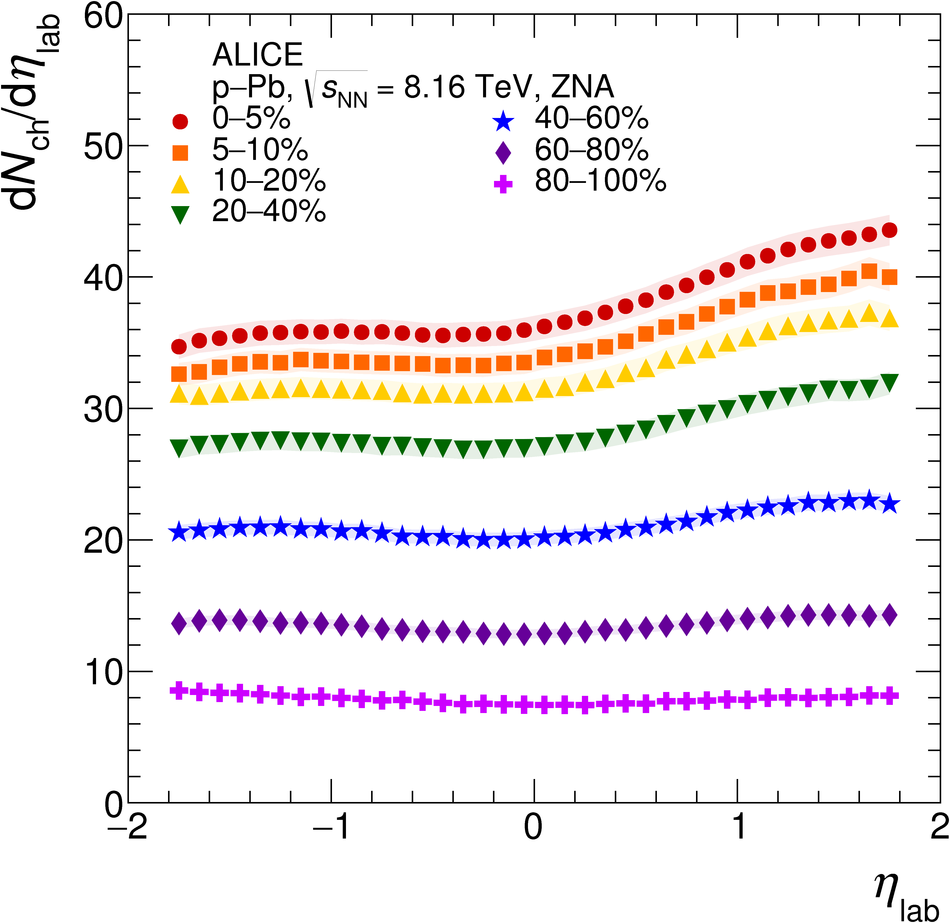
The pseudorapidity density of charged particles, $\rm{d}\it{N}_\rm{ch}/\rm{d}\it{\eta}$, in p-Pb collisions has been measured at a centre-of-mass energy per nucleon-nucleon pair of $\sqrt{s_{\rm{NN}}}$ = 8.16 TeV at mid-pseudorapidity for non-single-diffractive events. The results cover 3.6 units of pseudorapidity, $|\eta|<~1.8$. The $\rm{d}\it{N}_\rm{ch}/\rm{d}\it{\eta}$ value is $19.1\pm0.7$ at $|\eta|<~0.5$. This quantity divided by $\langle N_\rm{part} \rangle/2$, is $4.73\pm0.20$, which is 9.5% higher than the corresponding value for p-Pb collisions at $\sqrt{s_{\rm{NN}}}$ = 5.02 TeV. Measurements are compared with models based on different mechanisms for particle production. All models agree within uncertainties with data in the Pb-going side, while HIJING overestimates, showing a symmetric behaviour, and EPOS underestimates the p-going side of the $\rm{d}\it{N}_\rm{ch}/\rm{d}\it{\eta}$ distribution. Saturation-based models reproduce the distributions well for $\eta>-1.3$. The $\rm{d}\it{N}_\rm{ch}/\rm{d}\it{\eta}$ is also measured for different centrality estimators, based both on the charged-particle multiplicity and on the energy deposited in the Zero-Degree Calorimeters. A study of the implications of the large multiplicity fluctuations due to the small number of participants for systems like p-Pb in the centrality calculation for multiplicity-based estimators is discussed, demonstrating the advantages of determining the centrality with energy deposited near beam rapidity.


Eur. Phys. J. C (2019) 79: 307
HEP Data
e-Print: arXiv:1812.01312 | PDF | inSPIRE
CERN-EP-2018-315

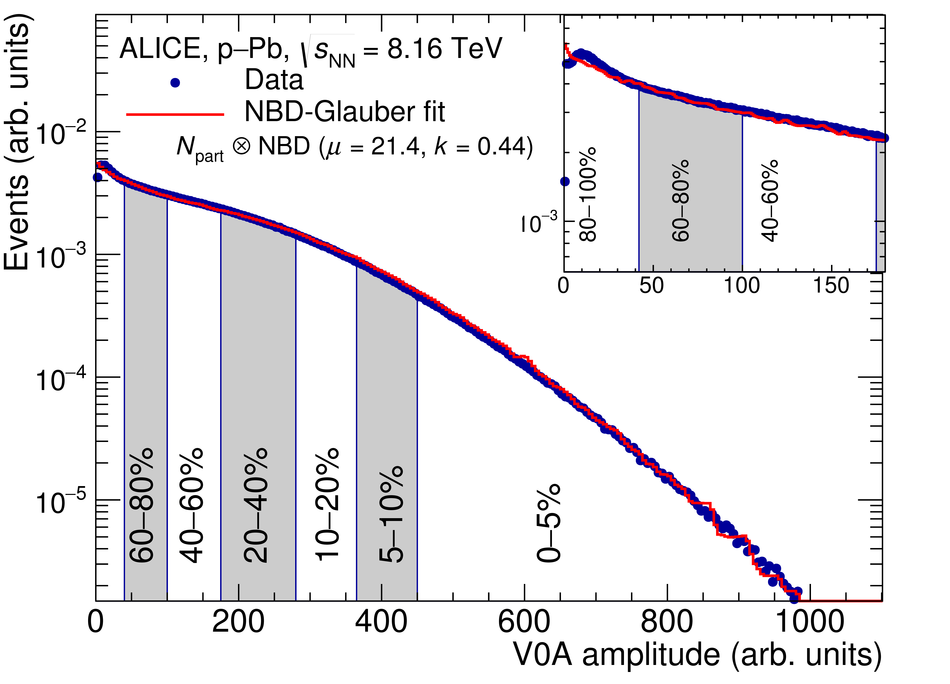
Figure 1

Distribution of the sum of amplitudes in V0A (Pb-going side) and the NBD-Glauber fit in red. Centrality classes are indicated by vertical lines and the inset shows the most peripheral events in more detail.

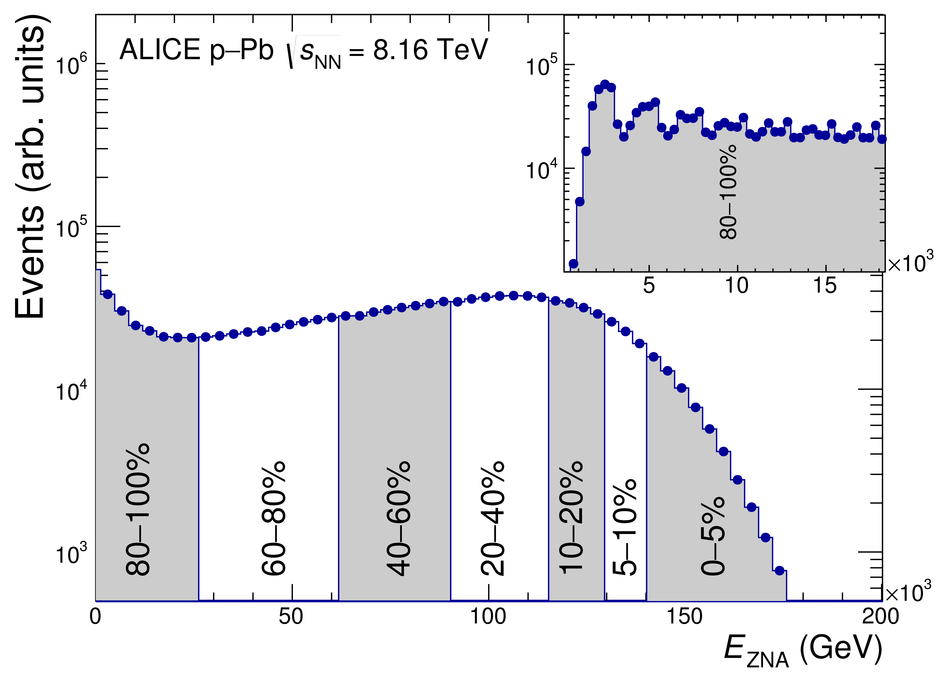
Figure 2

Distribution of the neutron energy spectrum measured in the Pb-going side (ZNA). Centrality classes are indicated by vertical lines and the inset shows the most peripheral events in more detail.

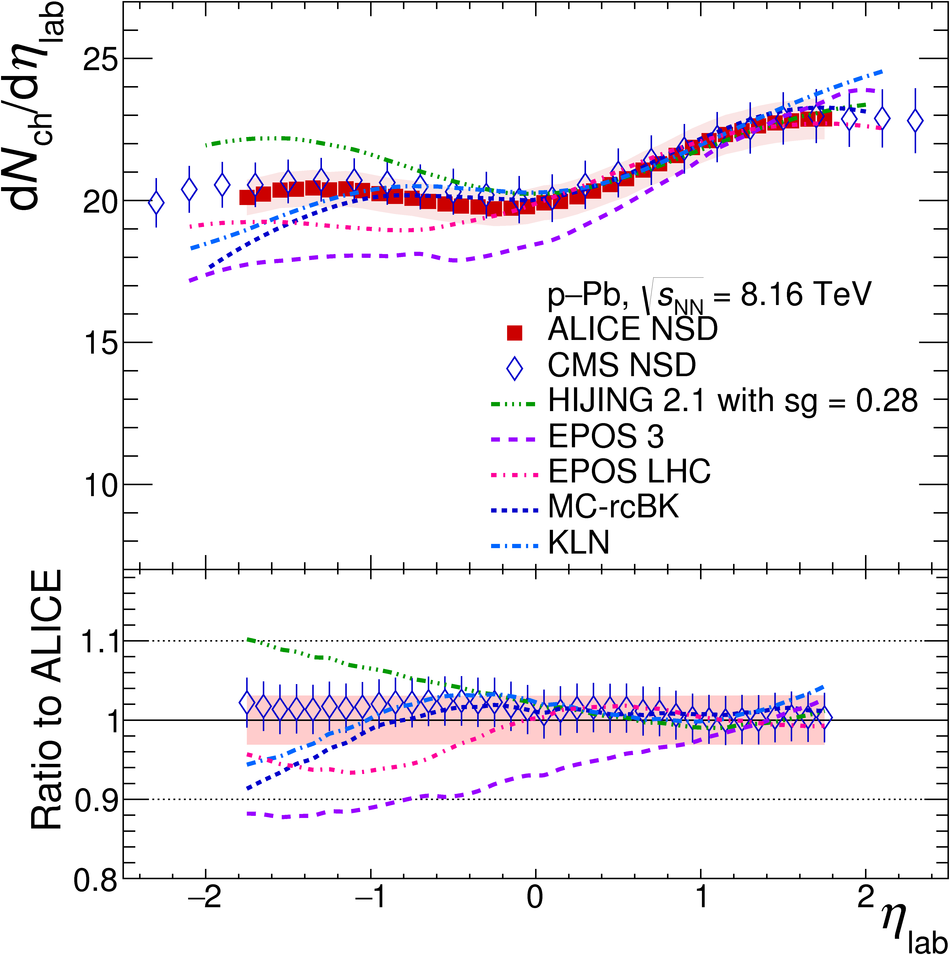
Figure 3

Red squares show the measured pseudorapidity density of charged particles in \pPb\ NSD collisions at \snn\ $=8.16$ TeV in ALICE, with total systematic uncertainties shown as bands, compared with CMS results  and theoretical predictions shifted to the laboratory system . The bottom panel shows the ratio to ALICE data.

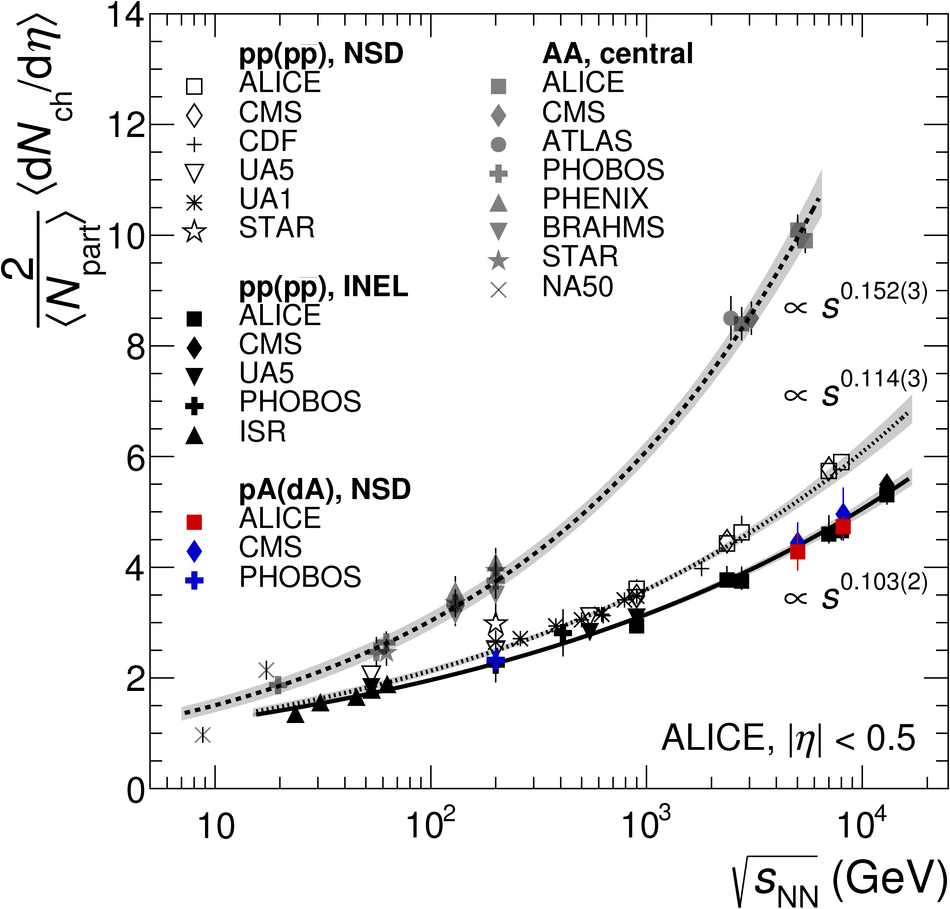
Figure 4

Values of \dNdetape\ for pA , pp and \ppbar   along with those from central AA collisions  as a function of \snn\ are shown, for $|\eta|< 0.5$. All values of \avNpart\ used for normalisation of data are the results of Glauber model calculations The $s$-dependencies of the \pp\ (\ppbar) inelastic (INEL) and \pPb\ collisions data are proportional to $s_{\rm NN}^{0.103}$ (solid line), while pp (\ppbar ) NSD are proportional to $s_{\rm NN}^{0.114}$ (dashed middle line). AA are proportional to $s_{\rm NN}^{0.152}$ (dashed upper line). The bands show the uncertainties on the extracted power-law dependencies.

Figure 6

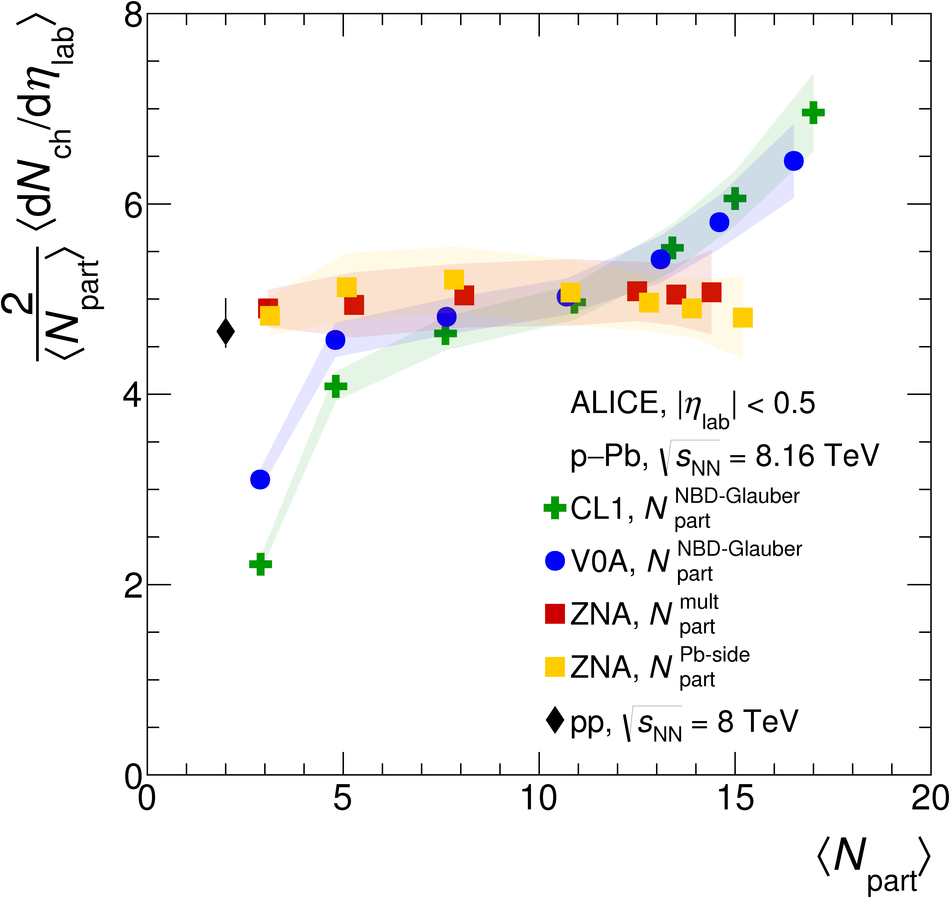
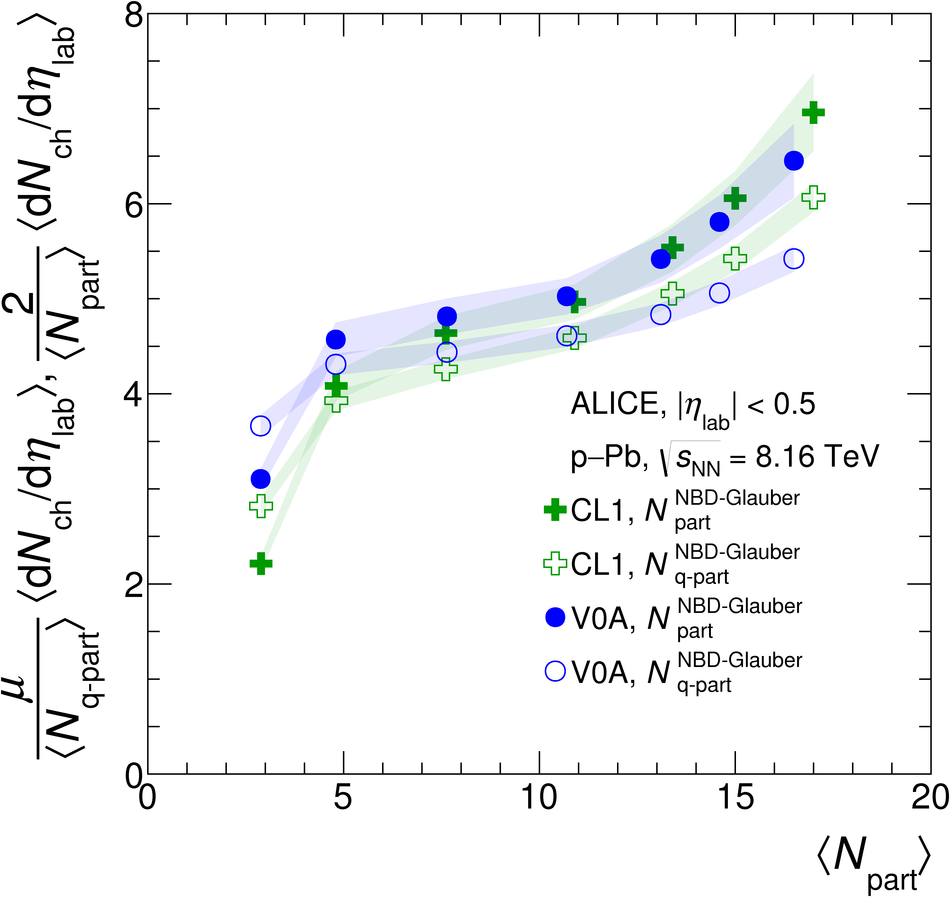
Left: \dNdetapelab\ in \pPb\ collisions at \snn\ $=8.16$ TeV and pp at 8 TeV  as a function of \avNpart\ for different centrality estimators. Right: \dNdetaquarklab\ for $N_{\rm c}=5$, open points, with $\mu=4.44$.