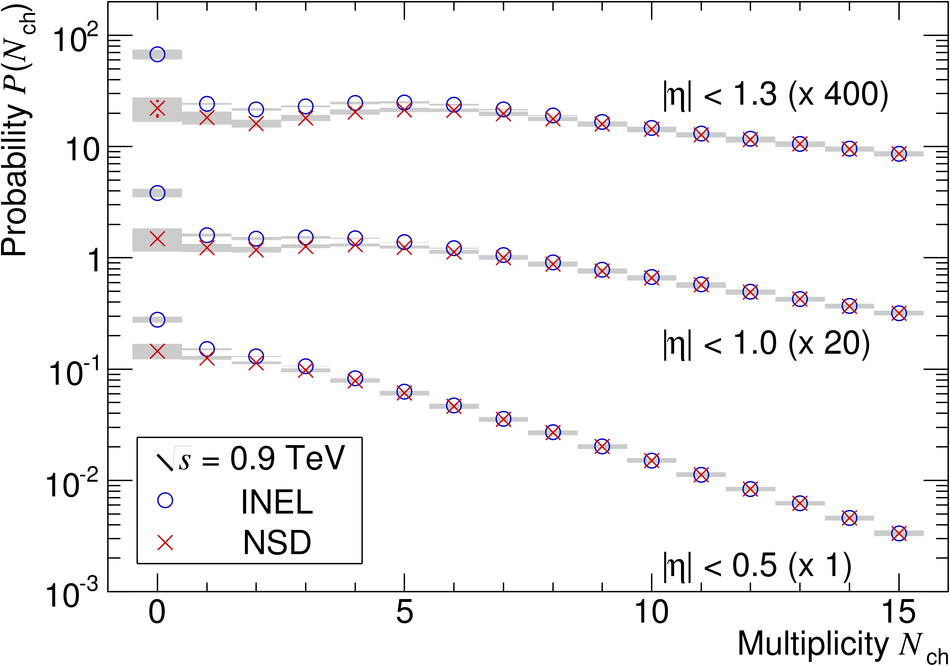
Expanded views of the low-multiplicity region of corrected multiplicity distributions for INEL and NSD events, top for 0.9 TeV and bottom for 2.36 TeV data. The gray bands indicate the systematic uncertainty. Distribution for NSD events are not normalized to unity but scaled down in such a way that the distributions for INEL and NSD events match at high multiplicities, which makes the difference at low multiplicity clearly visible. Left: data at $\sqrt{s} = 0.9 $TeV. Right: data at $\sqrt{s} = 2.36 $TeV. Note that for |$\eta$| < 1.0 and |$\eta$| < 1.3 the distributions have been scaled for clarity by the factor indicated. |  |