The $p_T$ distributions of primary charged particles at mid-rapidity ($|\eta|< 0.8$) in central (0--5%) and peripheral (70--80%)Pb--Pb collisions at $\sqrt{s_{_{NN}}} = 2.76 $TeV. Error bars are statistical only. The systematic data errors are smaller than the symbols The scaled pp references are shown as the two curves, the upper for 0--5% centrality and the lower for 70--80% The systematic uncertainties of the pp reference spectra are contained within the thickness of the line. | 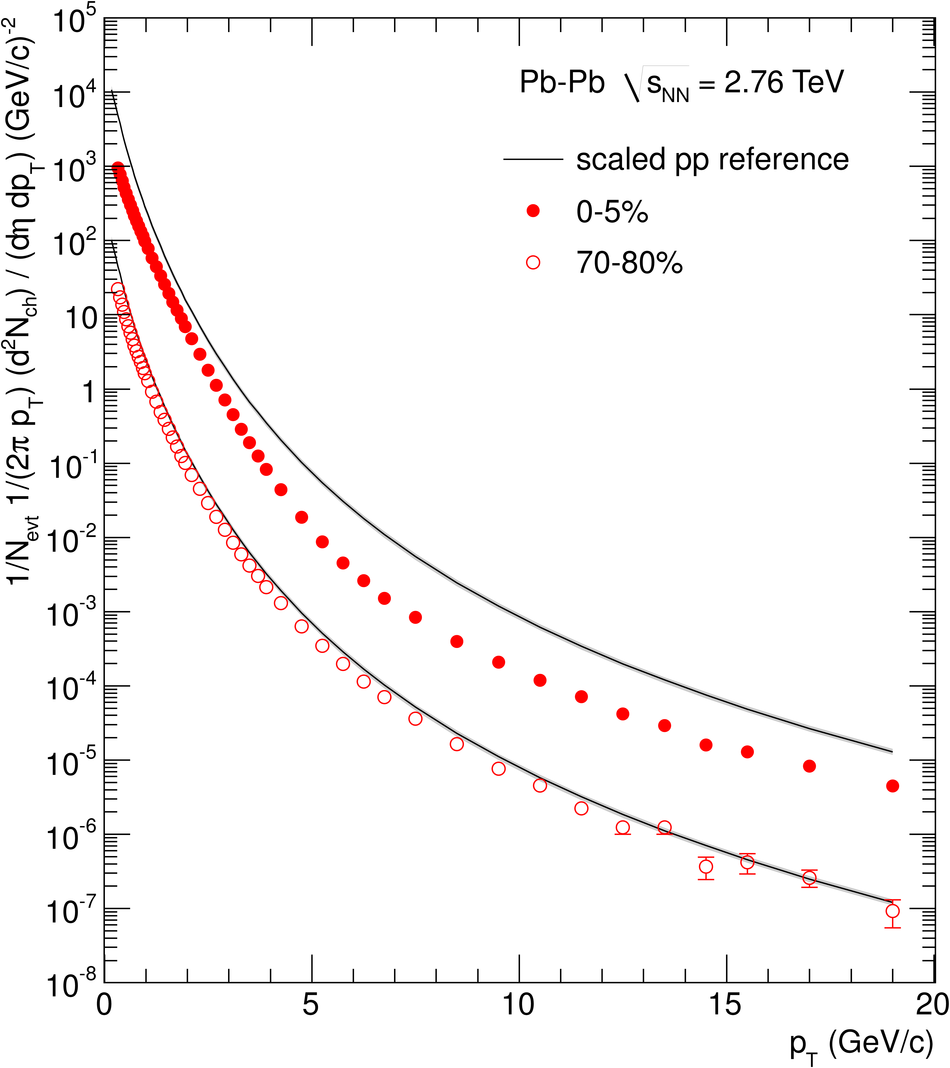 |