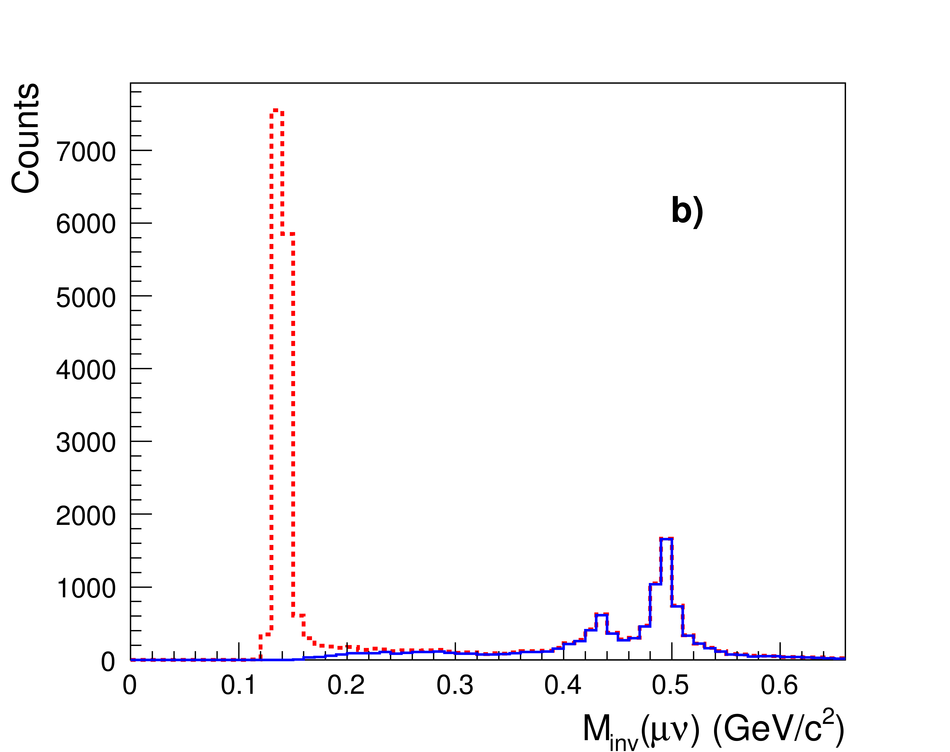
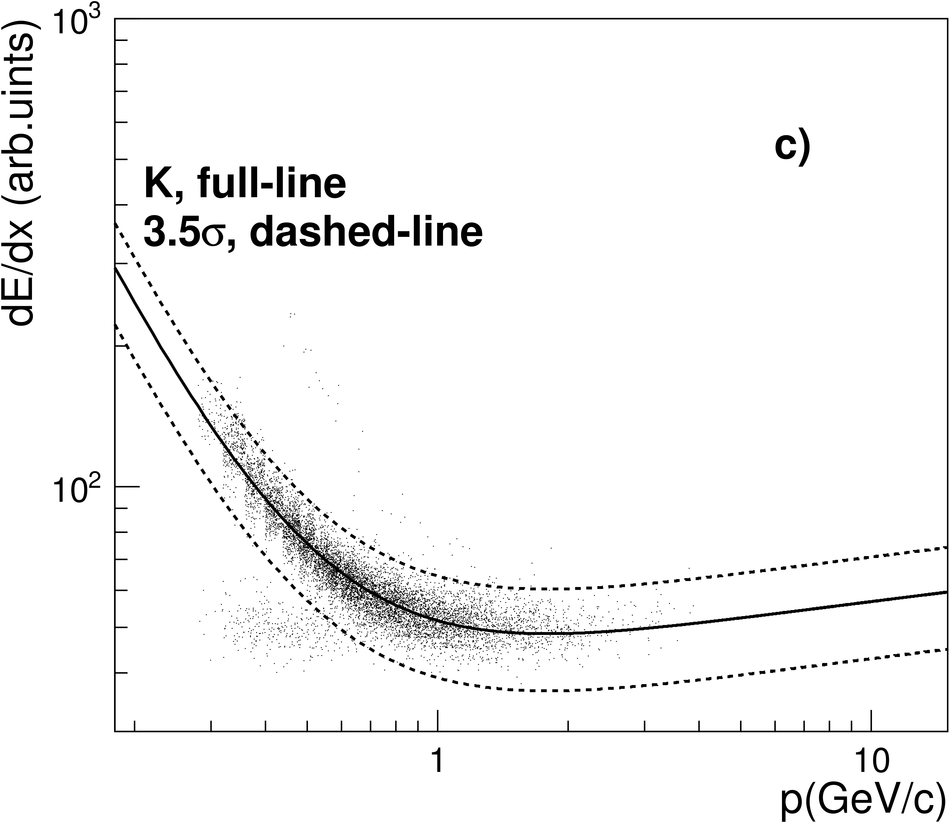
(a) $q_{\rm t}$ distribution of the daughter tracks with respect to mother momentum for all reconstructed kinks inside the analyzed sample. The dashed(solid)histograms show the distribution before (after) applying the $q_{\rm t}> 40$ MeV/$c$ cut (b) Invariant mass of the two-body decays $\rm{K^\pm}/{\pi^\pm}\rightarrow\mu^\pm +\nu_{\mu}$ for candidate kaon kinks. Solid curve: after applying $q_{\rm t}>$40 MeV/$c$; dashed curve: without this selection (hence also showing the pion decays) (c) d$E$/d$x$ of kinks as a function of the mother momentum, after applying the full list of selection criteria for their identification. | 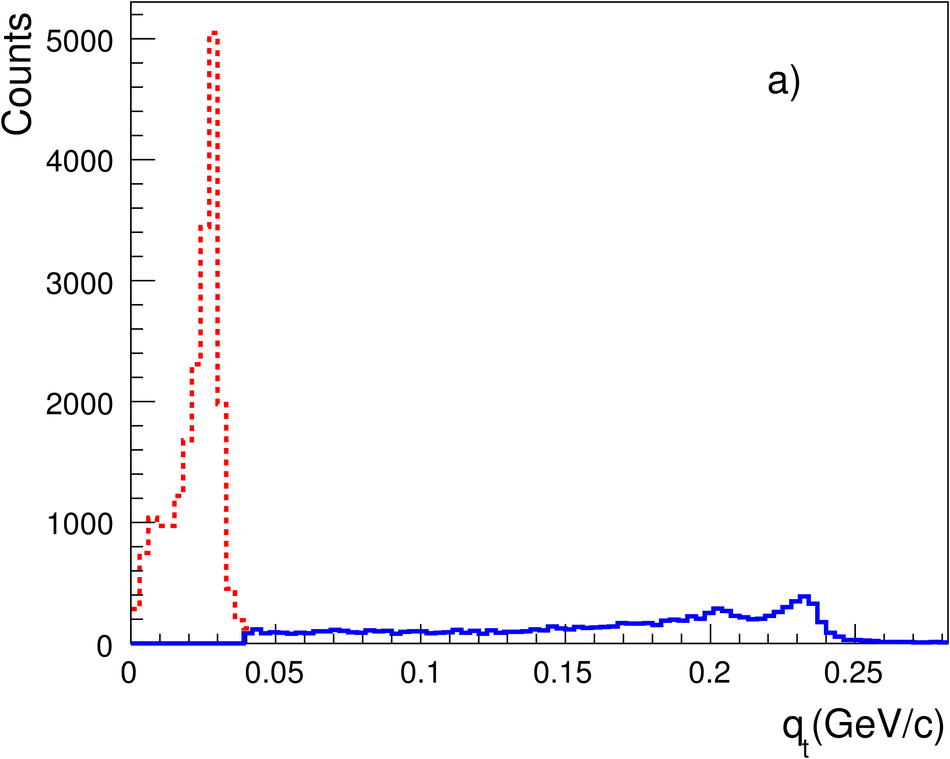 |