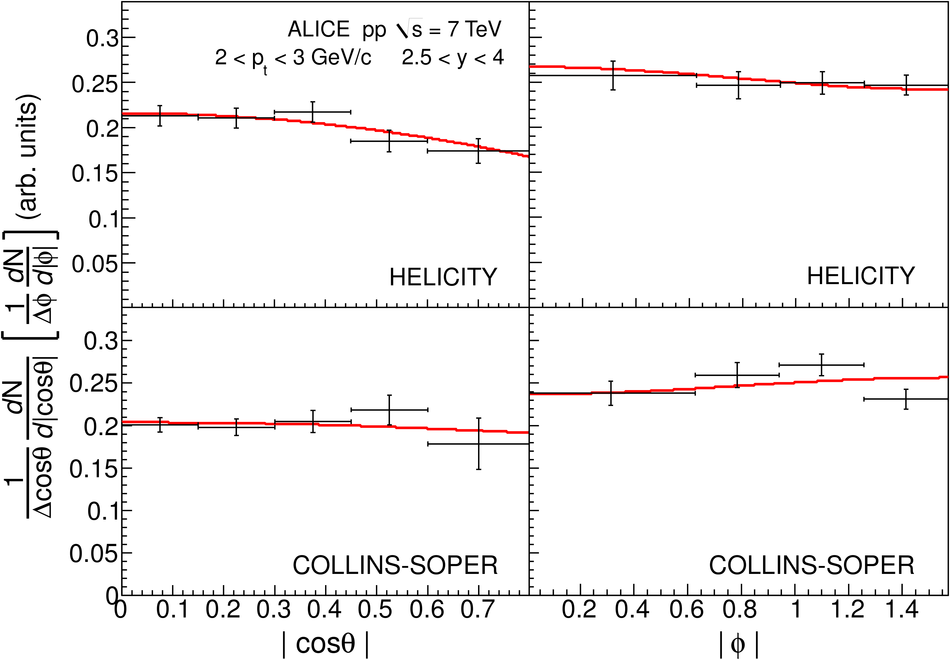
The acceptance corrected angular distributions for the J/$\psi$ decay muons, for $2< p_{\rm t}< 3$ GeV/$c$. The simultaneous fit to the results in the CS and HE frames is also shown. The plotted errors are purely statistical. The horizontal bars represent the bin width.}
|