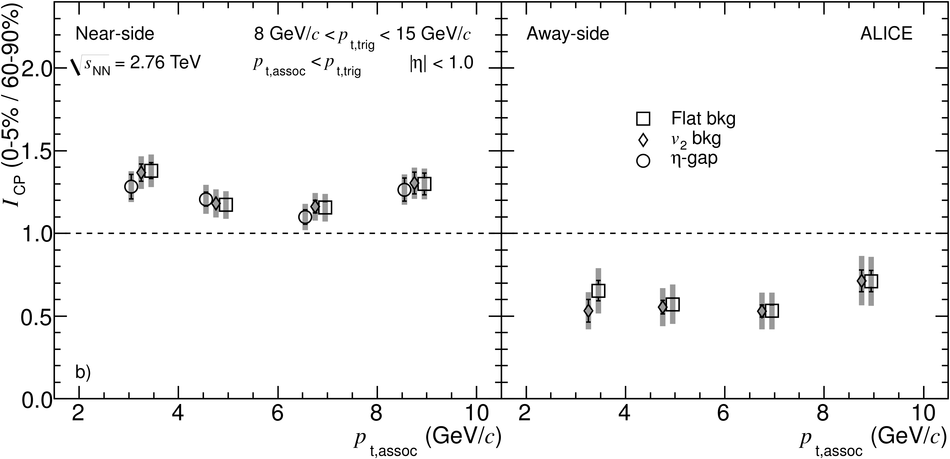
a) $I_{\rm AA}$ for central (0-5% Pb--Pb/pp, open black symbols) and peripheral
(60-90\% Pb--Pb/pp, filled red symbols) collisions. b) $I_{\rm CP}$. Results using different background subtraction schemes are presented: using a flat pedestal (squares), using $v_2$ subtraction (diamonds) and subtracting the large $|\Deta|$-region (circles, only on the near-side). For details see text. For clarity, the data points are slightly displaced on the $p_{\rm t, assoc}$-axis. The shaded bands denote systematic uncertainties.} | 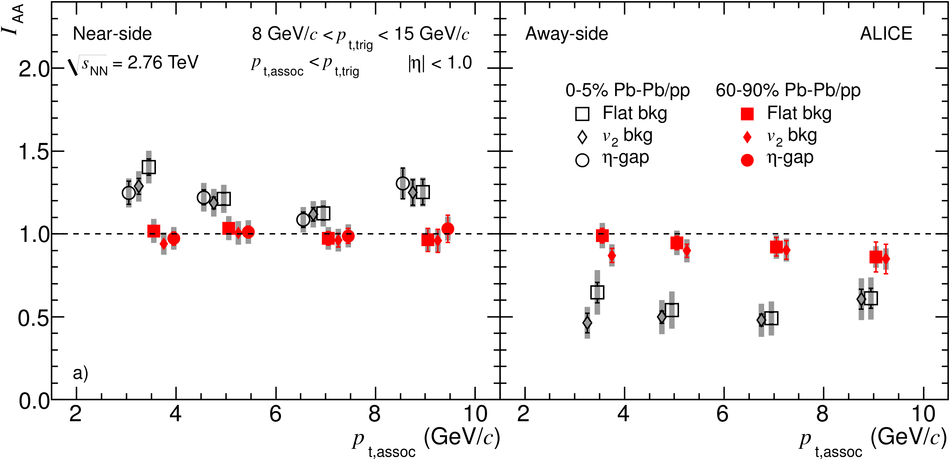 |