Invariant mass distributions for $\Dzero$ (top) and $\Dplus$ (middle) candidates, and mass difference distribution for $\Dstar$ candidates (bottom), for three $\pt$ intervals. The curves show the fit functions as described in the text. The values of mean ($\mu$) and width ($\sigma$) of the signal peakare reported (for $\Dzero$ and $\Dplus$ they are expressed in $\gev/c^2$) | 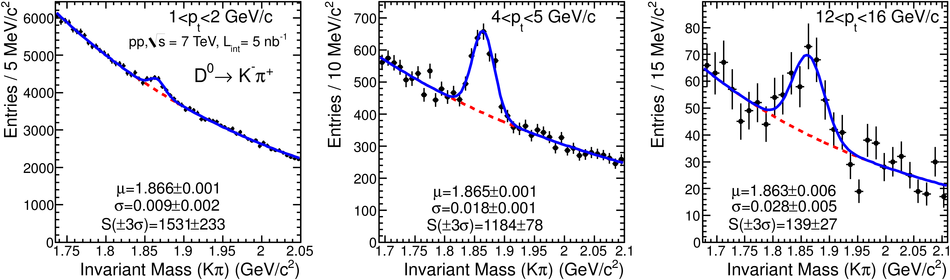 |

