Left: ${C \left(\Delta \phi \right)}$ for particle pairs at $|{\Delta\eta}| > 0.8$. The Fourier harmonics for $V_{1\Delta}$ to $V_{5\Delta}$ are superimposed in color. Their sum is shown as the dashed curve. The ratio of data to the $n \leq 5$ sum is shown in the lower panel. Center: Amplitude of ${V_{n\Delta}}$ harmonics vs.\ $n$ for the same ${p_{T}^{t}}$, ${p_{T}^{a}}$, and centrality class. Right: ${V_{n\Delta}}$ spectra for a variety of centrality classes. Systematic uncertainties are represented with boxes (see section 4 Factorization and the global fit), and statistical uncertainties are shown as error bars. | 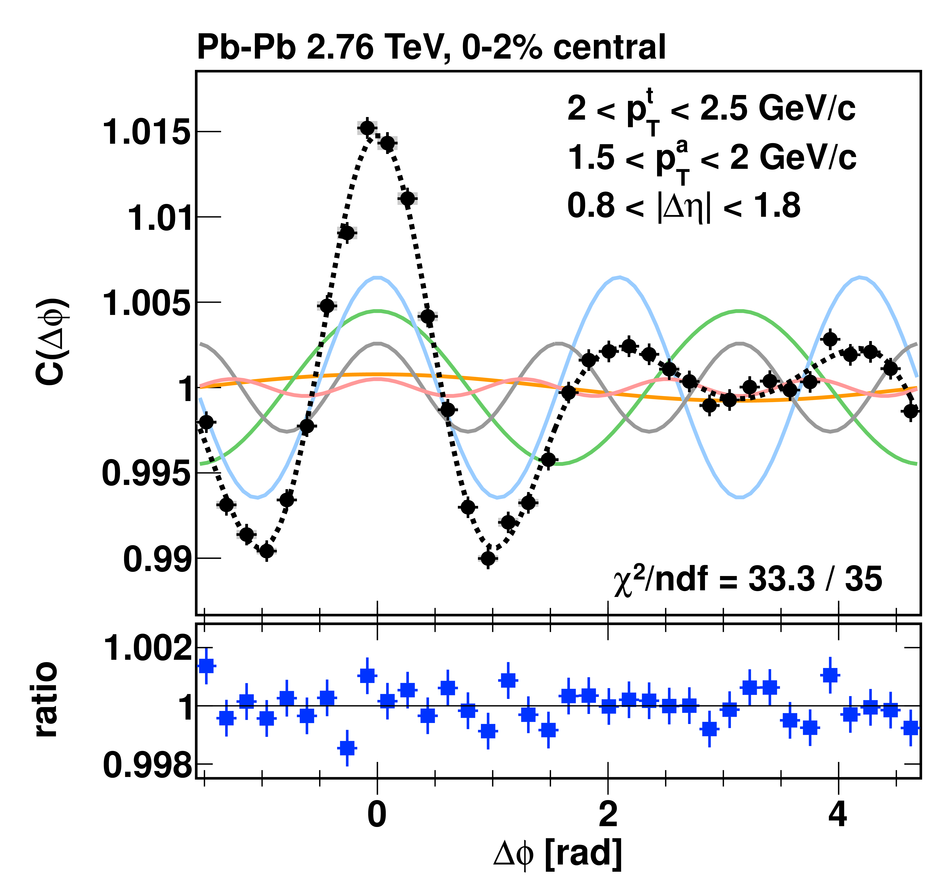 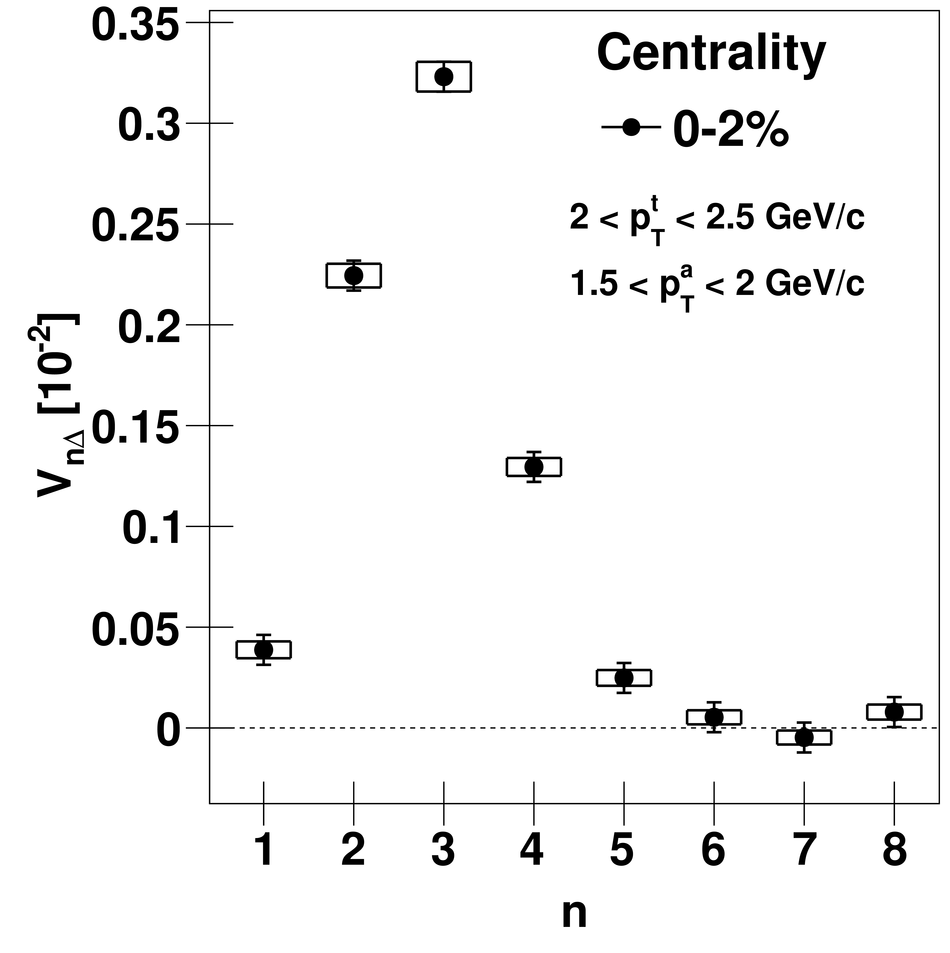 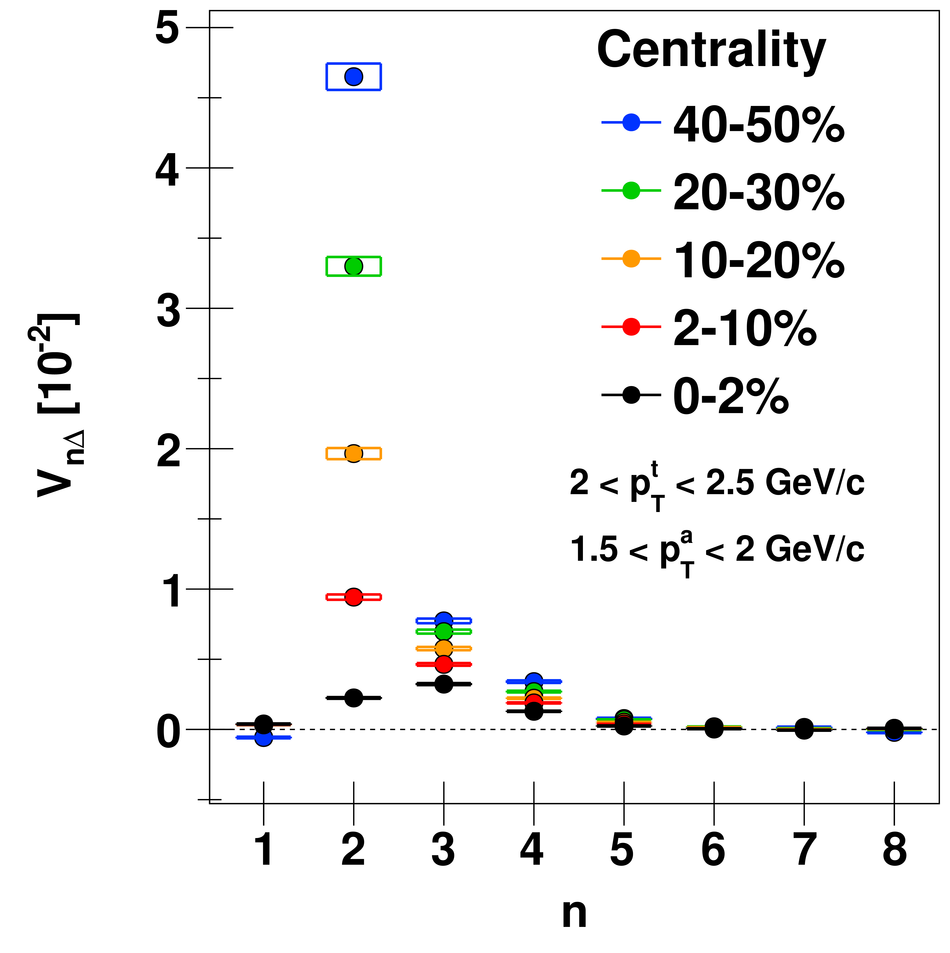 |