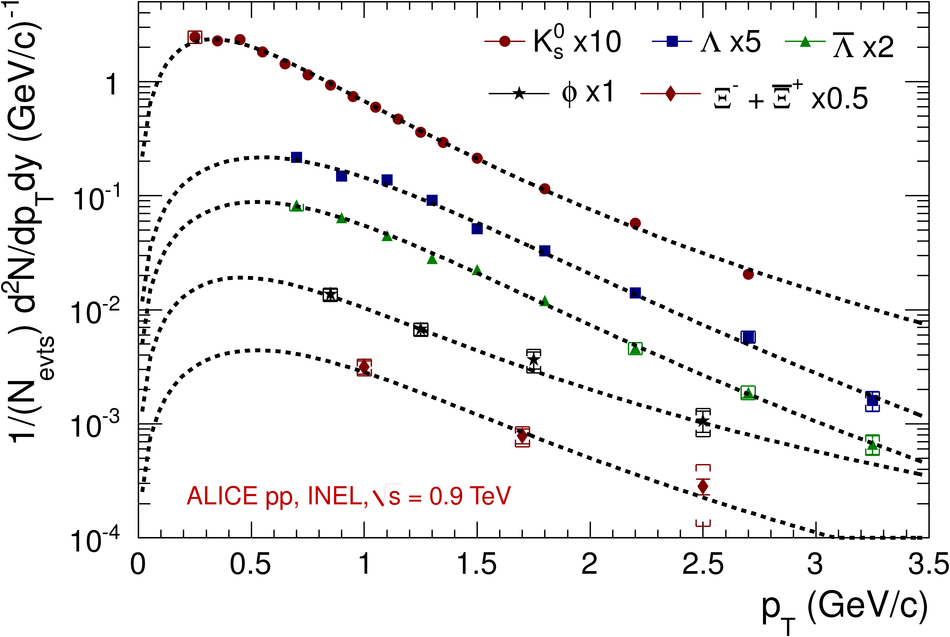
Particle spectra (corrected yields) as a function of $\pT$ for $\Kzs$ (circles),$\mathrm {\Lambda}$ (squares), $\mathrm {\overline{\Lambda}}$ (triangles), $\phi$ (stars) and $\mathrm {\Xi^{-}+\overline{\Xi}^{+}}$ (diamonds). The data points are scaled for visibility and plotted at the centre of the bins Uncertainties corresponding to both statistics (i.e. the number of reconstructed particles)and systematics from the signal extraction are shown as vertical error bars Statistical uncertainties and systematics (summarized in Table 4) added in quadrature are shown as brackets The fits (dotted curves) using $L\grave{e}vy$ functional form [see Eq.2] are superimposed
(2)d2Ndyd\pT=(n−1)(n−2)nT[nT+m(n−2)]×dNdy×\pT×(1+mT−mnT)−n |  |