Alignment stability tests Top: for SPD only, distribution of the $\Delta xy\vert_{y=0}$ distance obtained when aligning with every second track and checking the alignment with the other tracks Bottom: track-to-point residuals in the inner SPD layer (track fit in outer SPD layer and in the two SSD layers), for $\rm B=0$ and $\rm B=\pm 0.5 T$ (the three histograms are normalized to the same integral). | 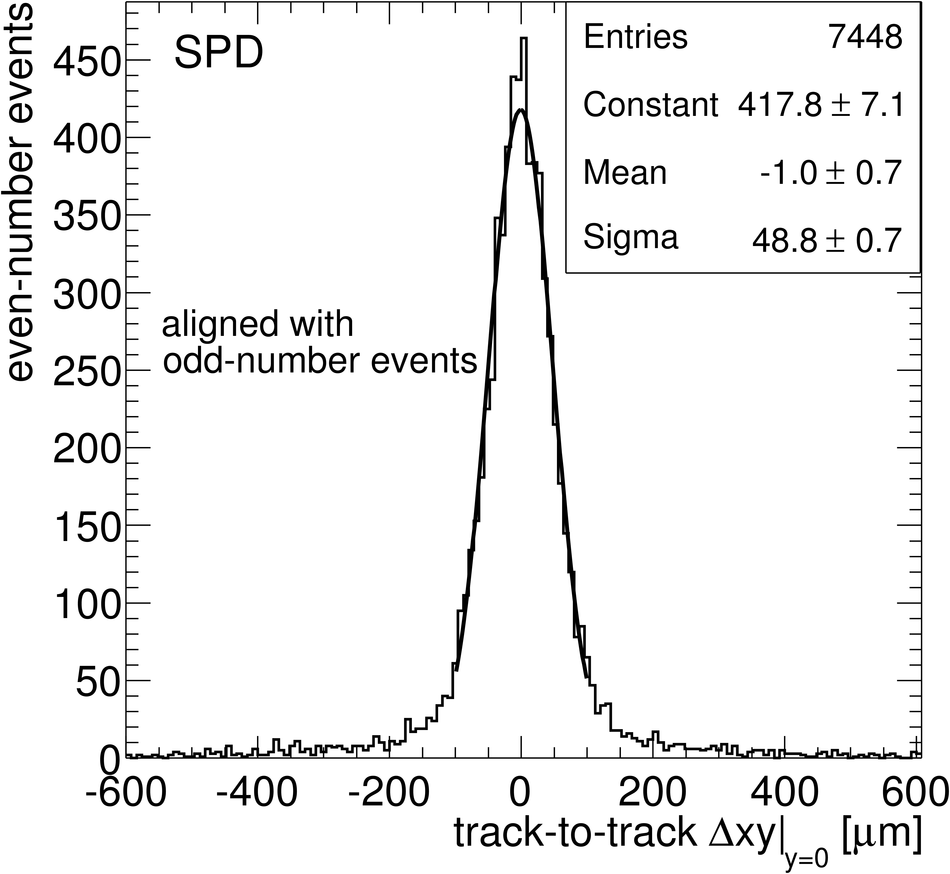 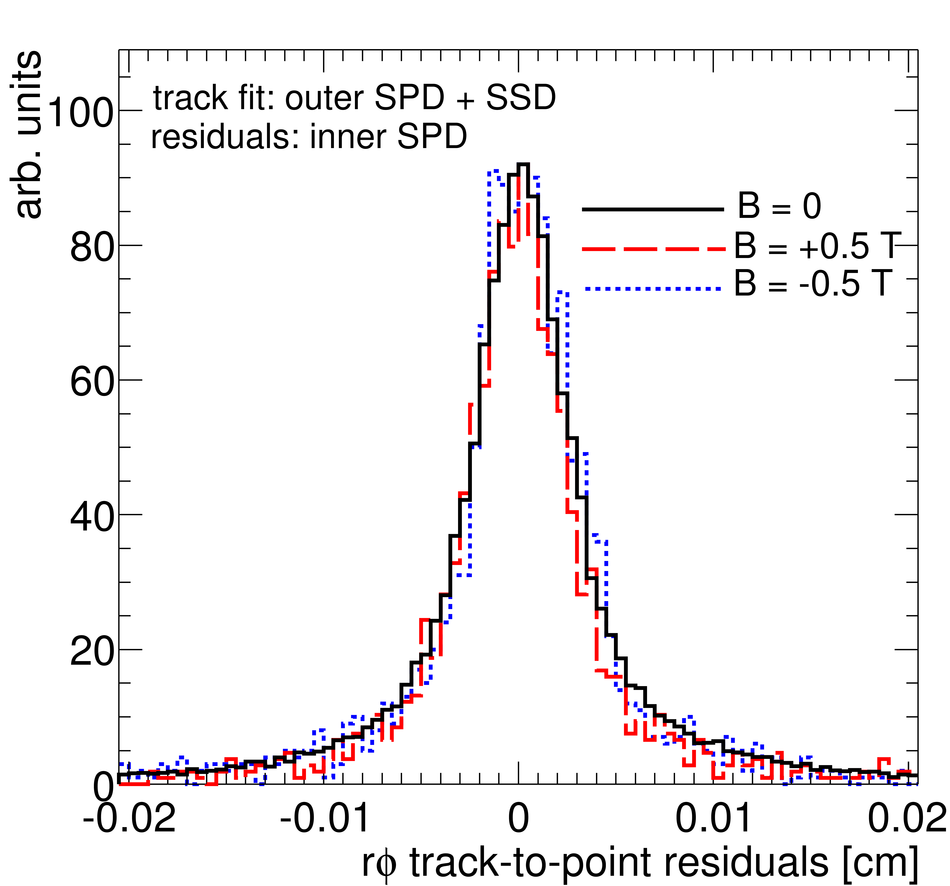 |